- Location Strategy Chartbook
- Posts
- Location Strategy Chartbook 01.17.2026
Location Strategy Chartbook 01.17.2026
Real Estate Market Insights
U.S. Treasury yields rose on Friday as investors monitored the economic outlook and geopolitical concerns.
The benchmark 10-year Treasury yield gained more than 6 basis points to 4.227%. The yield on the 2-year Treasury advanced 3 basis points to 3.594%. The 30-year Treasury yield was also more than 5 basis points higher at 4.836%.


The Bureau of Labor Statistics recently reported a headline-grabbing 4.9% annualized increase in labor productivity for the third quarter of 2025, a figure notable for its broader implications even for data that can be difficult to measure and is famously volatile.
The longer-term increase of 1.9% over the year marked the third consecutive quarter of annual productivity growth and represents a significant improvement from the 1.2% average rate in the 2010s, a decade characterized by weak productivity growth during the recovery from the Great Recession.
Still, a closer look at the data reveals a challenging trend for job-seekers and policymakers alike: Employment gains and economic growth are becoming increasingly decoupled.
Demographic trends, immigration restrictions and employer caution are limiting job growth, while technology-driven investments are boosting economic output. Since 2017, labor productivity, defined as economic output per hour worked, has risen nearly 18%, but labor compensation’s share of that output fell roughly 5%, its lowest level on record.
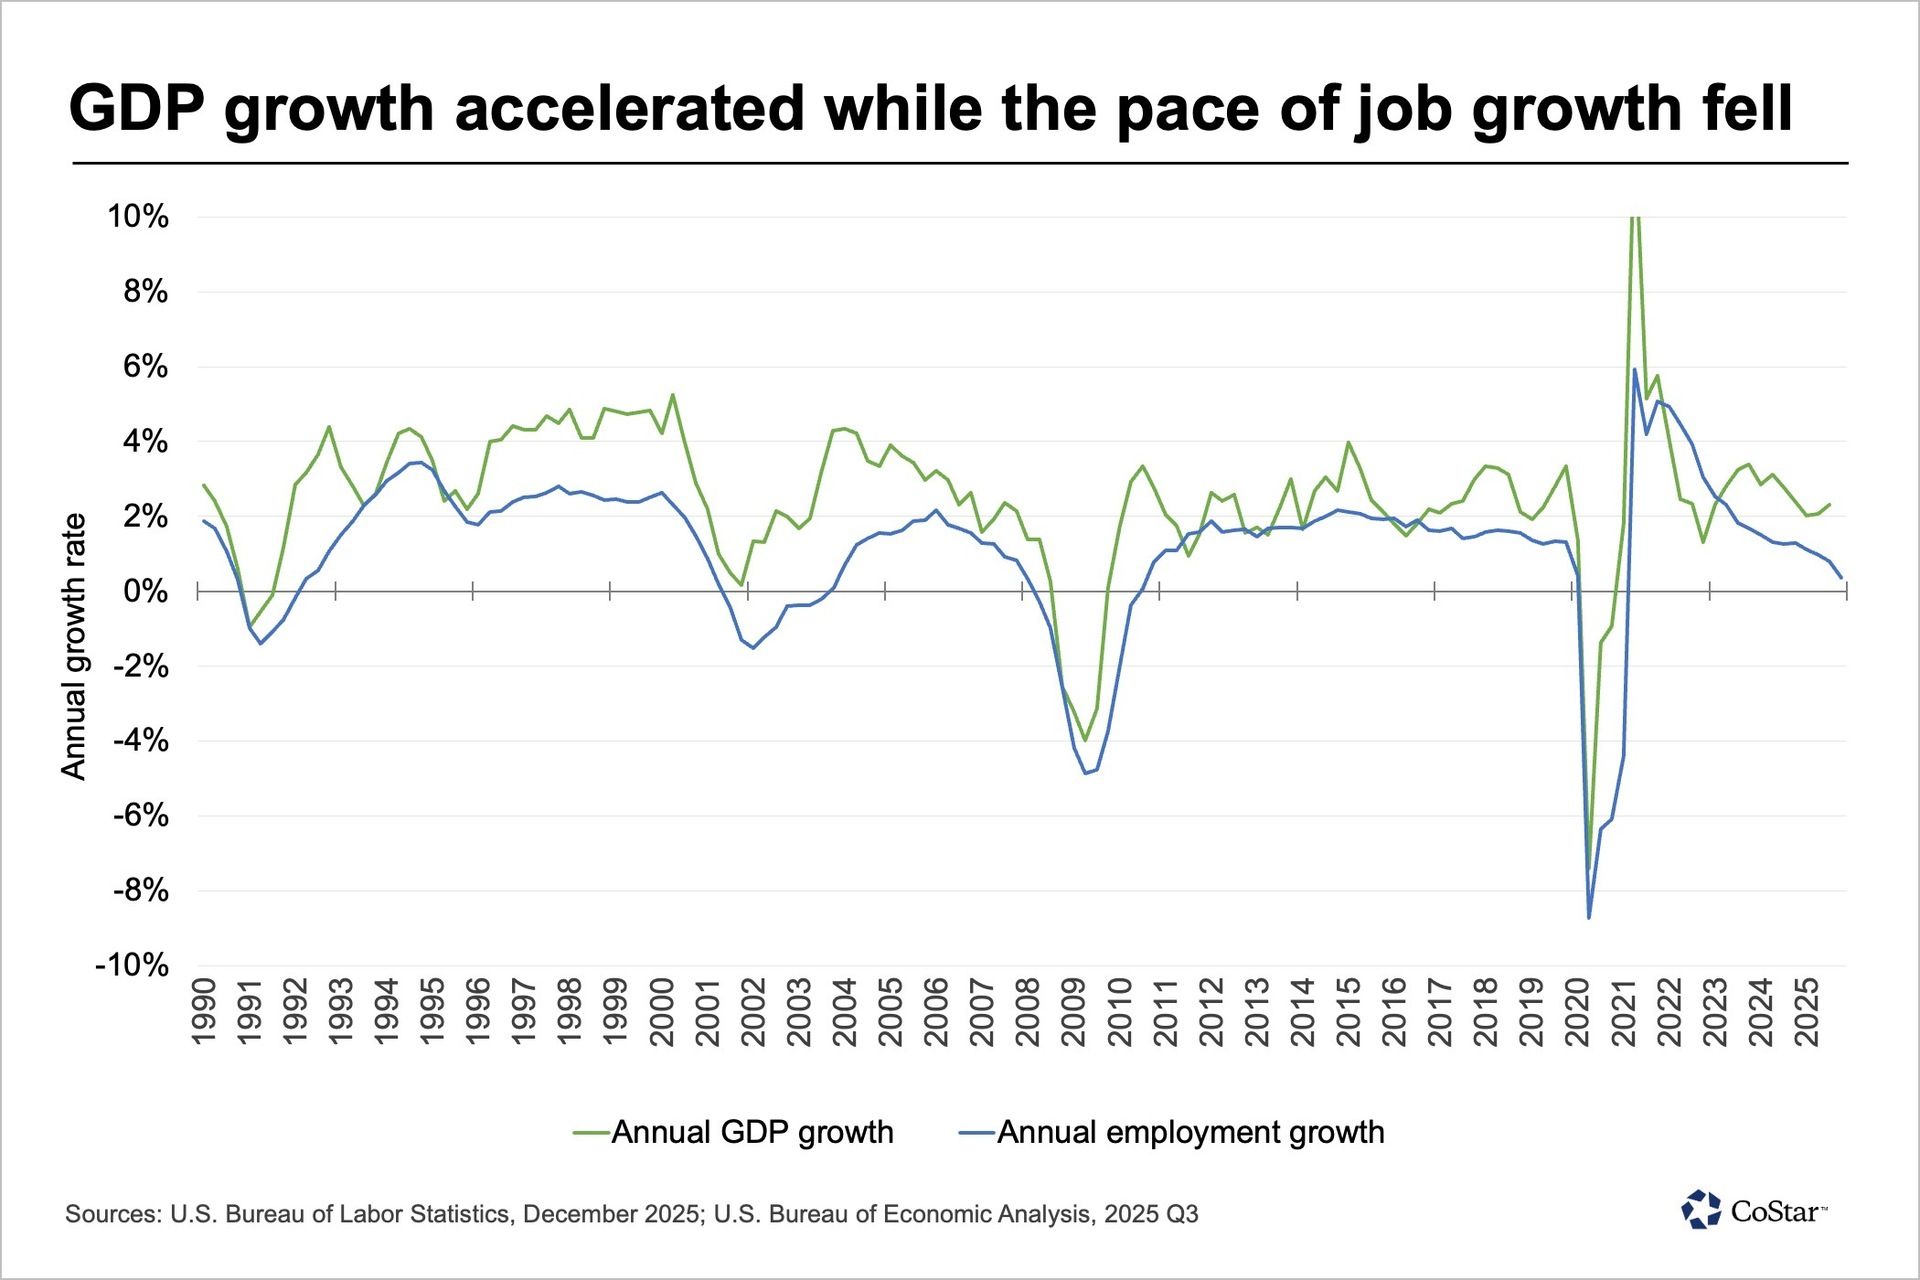

Limited growth in the labor force, due to immigration restrictions and the continued aging of the workforce, blunted the impact of this slower growth on the unemployment rate. The unemployment rate grew 0.3 percentage points to 4.4% in 2025, while the labor force participation rate fell 0.1 percentage points to 62.4%
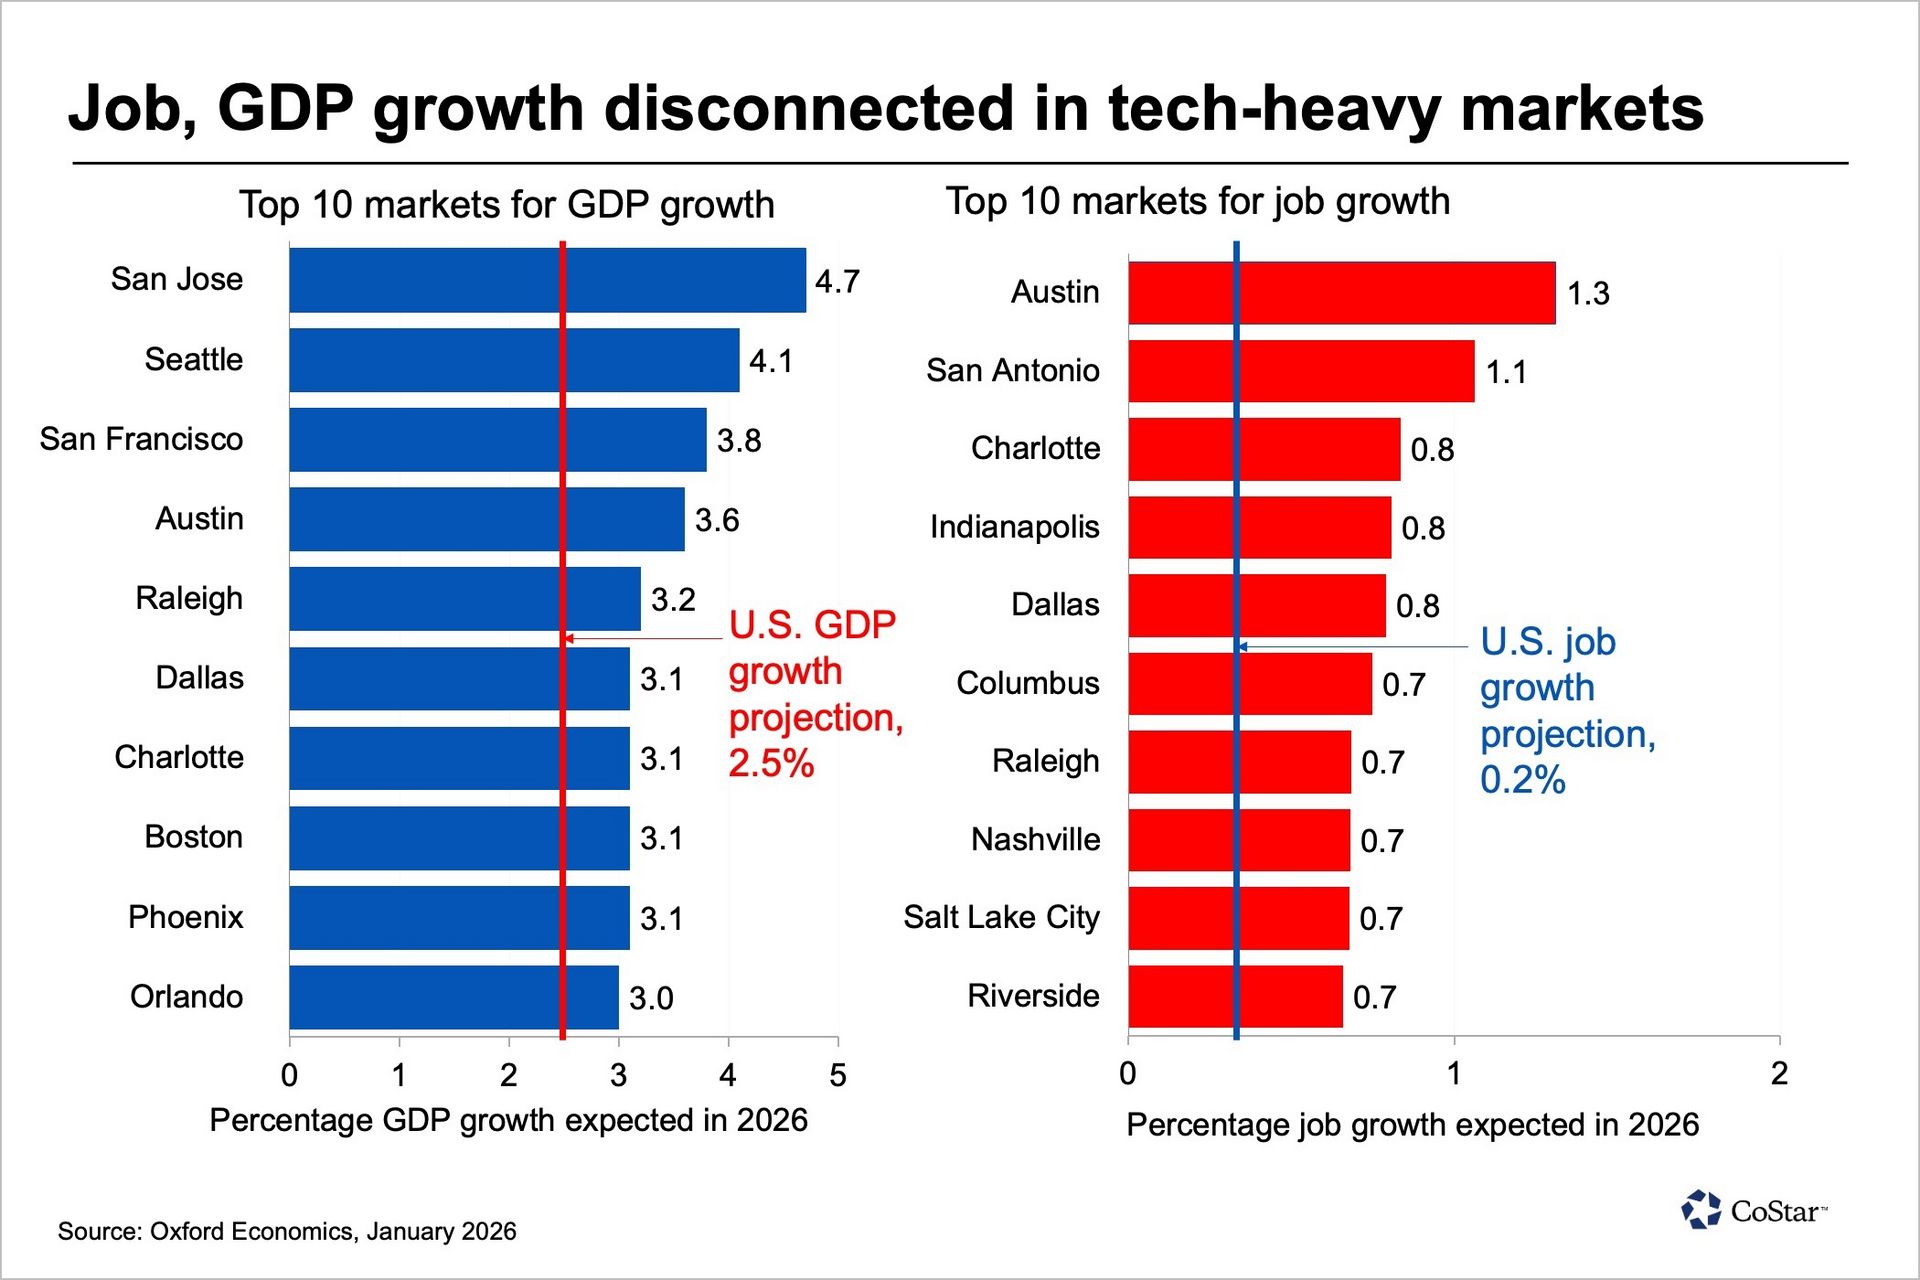
Indeed, productivity-enhancing technological investments, combined with slower labor force growth, will likely enhance the disconnect between employment and economic growth. While Oxford Economics projects a 2.5% increase in GDP in 2026, employment growth is projected to slow to 0.2%.
This divergence may be even more pronounced in metropolitan areas at the frontier of technological investments. San Jose, for example, is expected to lead the nation in GDP growth at 4.7% while adding only 0.4% to its regional payrolls. Among the top 10 projected GDP growth leaders in 2026, the disconnect is similar in Seattle (4.1% GDP growth, 0.4% employment growth), San Francisco (3.8% GDP growth, 0.2% employment growth) and Boston (3.1% GDP growth, 0.1% employment growth).
JPMorgan Chase CFO Jeremy Barnum hinted Tuesday the industry could fight President Donald Trump’s demand for credit card price controls, saying “everything’s on the table.”
“If you wind up with weakly supported directives to radically change our business that aren’t justified, you have to assume that everything’s on the table,” Barnum said on a call with reporters following JPMorgan’s fourth-quarter earnings report. “We owe that to shareholders.”
Barnum was responding to a question about whether banks would choose to litigate to block Trump’s demand, made late Friday, that card companies cap interest rates at 10% for a year. Last year, the industry successfully fought efforts by the Consumer Financial Protection Bureau to cap card late fees.
“People will lose access to credit… that’s a pretty severely negative consequence for consumers and frankly, probably also a negative consequence for the economy as a whole,” said Barnum.
“If you make these products unprofitable, that [$6 trillion] spending will be drastically reduced – and that’s British understatement,” said Citigroup’s UK-born CEO, Jane Fraser.
“You will see unintended consequences,” said Bank of America CEO Brian Moynihan.
It’s a position they’ve been in before. In 2009, the Credit Card Accountability Responsibility and Disclosure (CARD) Act restricted card companies’ flexibility to change rates on existing borrowing and extended the time consumers had to pay. It’s one of the reasons credit card rates are as high as they are today. “If you’re a restaurant and you can’t charge for the soda, you’re going to charge more for the burger,” Jamie Dimon said at the time. “And my guess is, over time, it will all be repriced into the business.”
It was. The spread between upfront card rates and the Fed Funds rate rose from around 10% prior to the Act to 14% afterwards. More recently, a now abandoned regulatory proposal to cap late payment fees led to another run-up in credit card spreads to their current level of around 18%.
Marc Rubinstein

WSJ
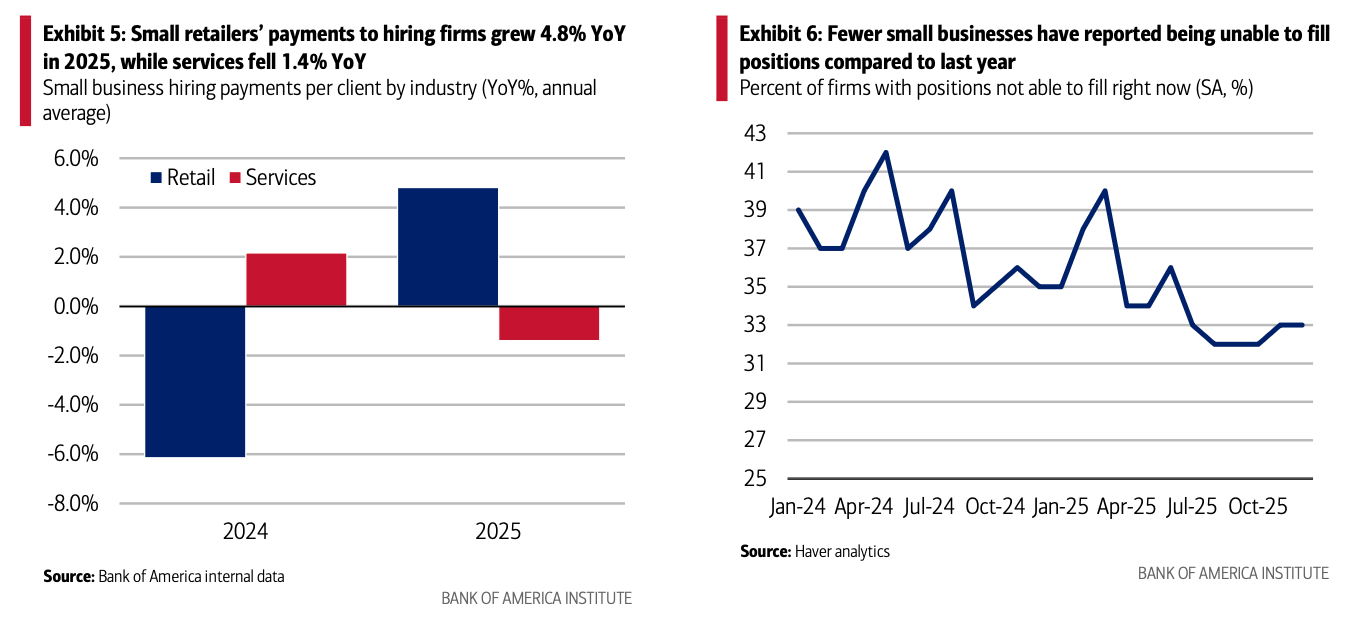
Small business profitability edged higher in 2025, with the Bank of America small business account inflow‑to‑outflow ratio rising slightly above 2024 levels. However, profits lost steam as the year closed, with year‑over‑year (YoY) profitability growth turning slightly negative for the second consecutive month in December, reflecting mounting cost pressures.
In the last few months of 2025, small business uncertainty trended downwards and optimism improved, according to the National Federation of Independent Business. Still, small business uncertainty has remained historically high over the past eighteen months due to a mix of consumer spending trends and policy affects such as tariffs.
After slowing throughout much of the second half of 2025, small business hiring activity picked up at year‑end, with payments to hiring firms up 7% from the 2024 average. Small retailers led the rebound, while services continued to lag, leaving the key question for 2026 as whether firms are ready to start hiring again.

Aided by strong tenant demand and a development community eager to see projects break ground, the two markets saw around 62 million square feet of new industrial projects started in 2025 alone.

For Dallas-Fort Worth, this trend has been a return to form for the market, which typically sees around 32 million square feet of groundbreakings during normal development cycles. One notable shift that did occur was in the construction of speculative space.
For most of the 2020s, construction built on speculation has been the primary driver of development in North Texas.
Bulk logistics, in particular, has seen a shift towards more build-to-suit or owner-occupied projects. Included in this is Amazon’s new 1.7-million-square-foot facility in Cleburne, which commenced construction in November 2024. Previous hotspots for this activity, like South Dallas, have seen developer appetite for speculative projects dry up as the market continues to work through prior deliveries. Instead, construction continues in areas such as Northeast Tarrant County, around the Alliance area, or in projects like Passport Park West, located near Dallas-Fort Worth Airport, where lenders are traditionally more confident in obtaining a return.
As of early 2026, the bulk logistics product currently under construction has an availability rate of nearly 65%, led by the 1.1-million-square-foot Alliance Westport 24, which is expected to be completed early in the first quarter.

Construction starts in Houston surged to a three-year high in 2025, driven largely by speculative development. More than 29 million square feet of industrial space broke ground — about 50% above 2024 and the highest level since 2022. Currently, 27 million square feet is underway, with 75% available for lease, much of it concentrated in the big-box segment. Over the past five years, Houston’s inventory of logistics properties 100,000 square feet or larger has grown by more than 30%.
Availability is especially elevated in the southeast near the Port of Houston, reflecting a steady influx of new supply. As of the first quarter of 2026, the East-Southeast Far submarket leads Houston with nearly 6 million square feet under construction.
In October, the 421,000-square-foot DC 10 in the Cedar Port Industrial Park in Baytown broke ground. In August, the 375,000-square-foot Baywood Logistics broke ground in Pasadena. Both of these properties are entirely available for lease.
Anchoring the submarket is the Port of Houston, one of the world’s largest ports. To meet rising demand, the $1 billion Project 11 is underway to expand and deepen the channel, with completion expected in 2028.
Beltway 8, the 88-mile loop encircling Houston, also remains a focal point for new projects, with most of the metropolitan area’s construction pipeline concentrated along this corridor.
Large logistics users continue to favor newer facilities, often at the expense of older properties.
While leasing activity remains robust, at more than 63% above pre-pandemic norms, this elevated pace of move-outs pushed headline net absorption to its lowest level in 13 years. Despite the churn, over 41 million square feet of industrial space was leased last year.
Orange County’s office market ended 2025 with its strongest momentum in more than a decade as tenant move‑outs slowed sharply and move‑ins accelerated, pushing quarterly net absorption to 1 million square feet. This marked the highest quarterly absorption total since 2013 and represented a clear uptick in demand.
Gross tenant move‑outs in the fourth quarter fell to a post‑pandemic low of 2.1 million square feet, while 3.1 million square feet of move‑ins reflected expansions by manufacturing companies and medical tenants. Hyundai, Anduril Industries and several medical users accounted for much of the late‑year expansion, helping offset earlier losses and bringing total 2025 net absorption above 800,000 square feet, its best annual performance since 2016.
The renewed demand helped pull vacancy in Orange County’s office market down heading into 2026. Vacancy dropped 70 basis points in the fourth quarter to under 12%, punctuating improvement from the 13.5% peak reached in 2023.

US mortgage rates slid last week to one of the lowest levels in years, sparking a flurry of purchase and refinancing activity that offers hope for a plodding housing market. The contract rate on a 30-year mortgage dropped 7 basis points to 6.18% in the week ended Jan. 9, according to Mortgage Bankers Association data released Wednesday. That’s the lowest reading since September 2024 and one of the lowest since 2022.

President Donald Trump announced that: “I am immediately taking steps to ban large institutional investors from buying more single-family homes, and I will be calling on Congress to codify it.” Soon afterwards, Senator Bernie Moreno (R-Ohio) tweeted that he’ll "introduce legislation in the Senate to codify this [ban] into law.”
On a national level, “large investors”—those owning at least 100 single-family homes—only own around 1% of total single-family housing stock. That said, in a handful of regional housing markets, institutional and large single-family landlords have a much larger presence. Markets like Phoenix and Atlanta became major hubs for institutional single-family rental investment following the 2008 housing crash as the asset class started to institutionalize. Firms such as Invitation Homes, Progress Residential, and AMH built sizable portfolios in these metros by acquiring distressed homes. That early activity helped establish a reliable local SFR ecosystem—including property management firms, leasing infrastructure, and contractor networks—that makes it easier to scale and expand single-family rental and build-to-rent operations today. Following the bottom-buying wave, institutional capital remained concentrated in high–population-growth Sun Belt markets, where investors anticipated stronger long-term growth in incomes and overall rental growth. Looking ahead, if a ban on institutional homebuying were enacted, its effects would likely be most pronounced in high-growth Sun Belt markets—especially in specific neighborhoods within metros such as Phoenix, Dallas, Atlanta, Austin, Tampa, Jacksonville, and Charlotte—where institutional ownership is more concentrated.

A forced institutional sell-off could temporarily put additional downward pressure on home prices in certain Sun Belt neighborhoods that are already experiencing corrections
One of the biggest questions right now is whether Trump’s proposed institutional ban would apply only to institutional scatter-site purchases (i.e., buying existing homes on the market) or also to build-to-rent development (i.e., building communities and homes specifically for rent). If policymakers were to also restrict institutional build-to-rent development, it could have a noticeable negative impact on overall homebuilding later in the decade, in 2027, 2028, and 2029. While single-family build-to-rent is currently only hovering around 8% of total U.S. single-family housing starts, it has driven much of the marginal increase in U.S. single-family housing starts in recent years. Back in pre-pandemic 2017 to 2019, single-family build-to-rent starts made up just around 3% of total U.S. single-family housing starts.
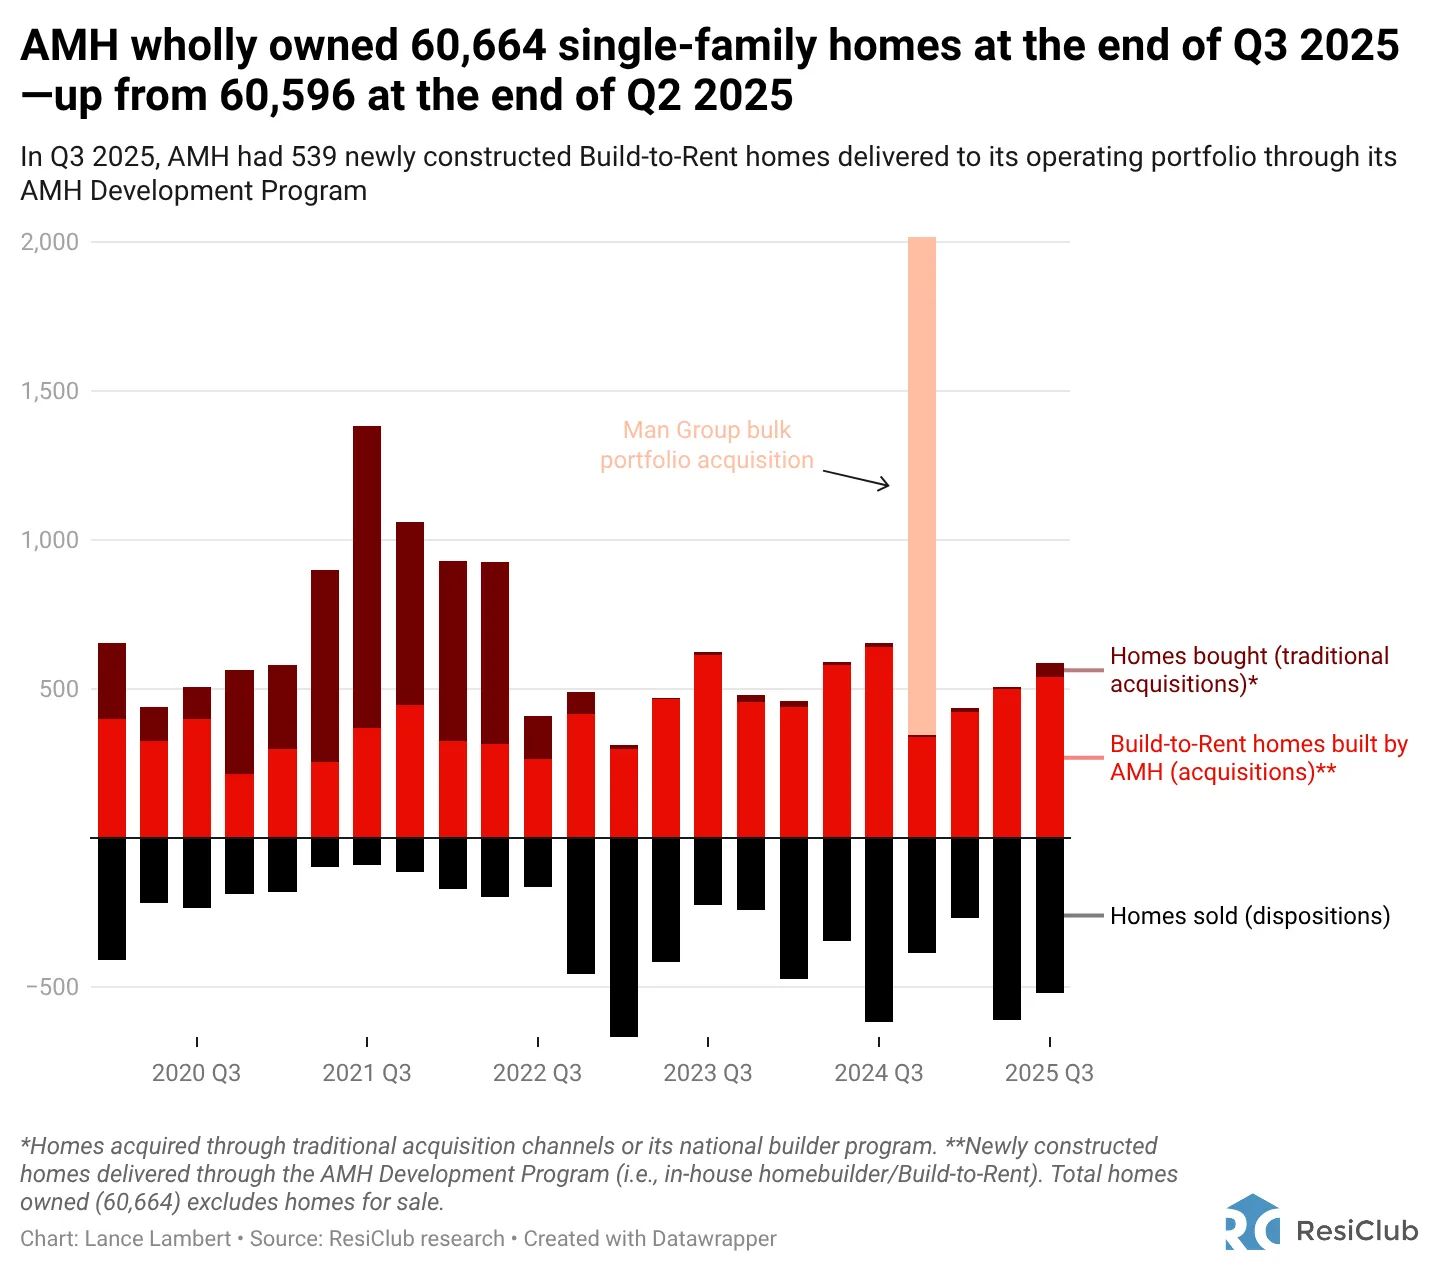
Not long after interest rates spiked in mid-2022 and the Pandemic Housing Boom fizzled out, many institutional landlords, including AMH, stopped buying via the MLS. However, AMH continued to barrel ahead building its own single-family rentals. Indeed, 95.7% of institutional landlord AMH’s single-family acquisitions through the first three quarters of 2025 came via its in-house homebuilding unit. According to Builder100, AMH’s in-house homebuilding unit ranks as the nation’s 37th-largest homebuilder.