- Location Strategy Chartbook
- Posts
- Location Strategy Chartbook 01.24.2026
Location Strategy Chartbook 01.24.2026
Real Estate Market Insights
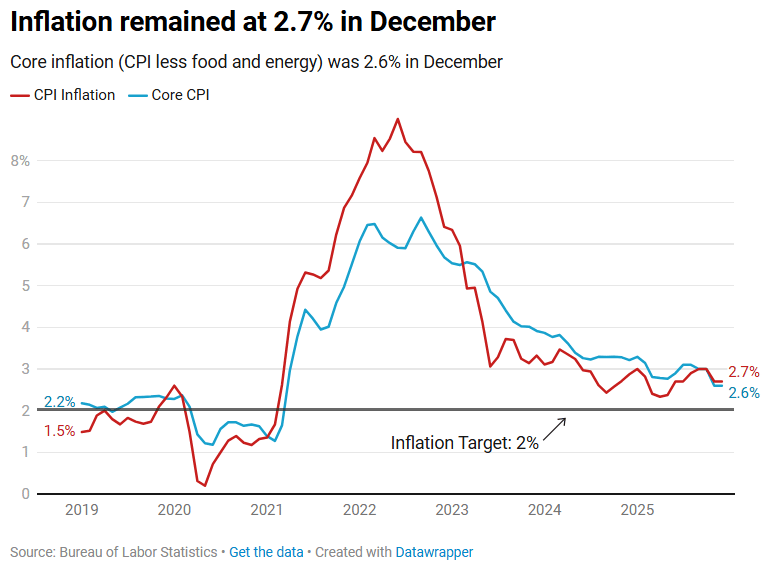
US inflation continues to come in lower than expected: 2.7% in December and Core Inflation (which doesn’t include food or energy costs) was 2.6% in December.
Food and energy (mainly utilities) continue to be key drivers of inflation right now. These are costs that all Americans pay regularly and can’t avoid.
In December alone, inflation ticked up 0.3%, but Core CPI was only up 0.2%.
A look at household balance sheets reveals a key driver of the disconnect between reported sentiment and actual spending. Asset-driven wealth accumulation, rather than employment-driven wage growth, is bolstering consumer spending. And that wealth accumulation has become increasingly concentrated among the highest-earning households.
The share of net worth held by the top 20% of households by income — those making more than $151,328 annually — reached 71.9% in the third quarter of 2025, according to Federal Reserve data. That is its highest share recorded since the Federal Reserve began tracking this data in 1989. Net worth is defined as the value of all assets, including real estate and stock portfolios as well as more liquid cash assets, minus total debt liabilities.


Delinquency rates on non-mortgage loans have begun to rise. The percentage of credit card balances more than 90 days delinquent reached 12.4% in the third quarter of 2025, up from 11.1% a year ago and a recent low of 7.6% in 2022. The resumption of student loan delinquency reporting after a three-year pause also pushed delinquencies to 9.4% of student loan balances.
Given the wealth distribution among households, these debt burdens are likely to affect middle-income households the most, as they hold higher levels of liabilities relative to their net worth than higher-income households.

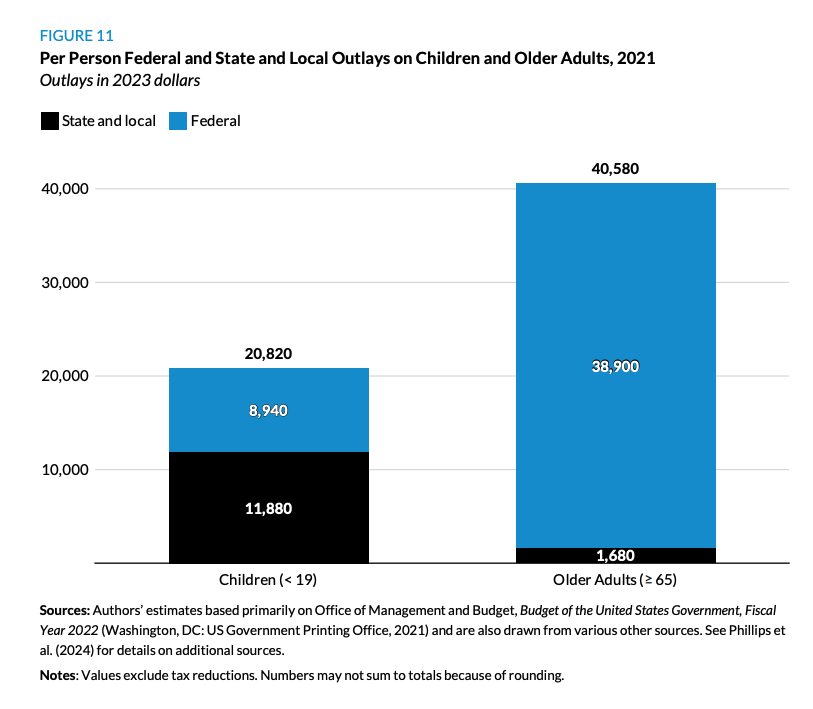
IFP: Across federal, state, and local governments, the US is spending twice as much taxpayer money on seniors as it is on kids.
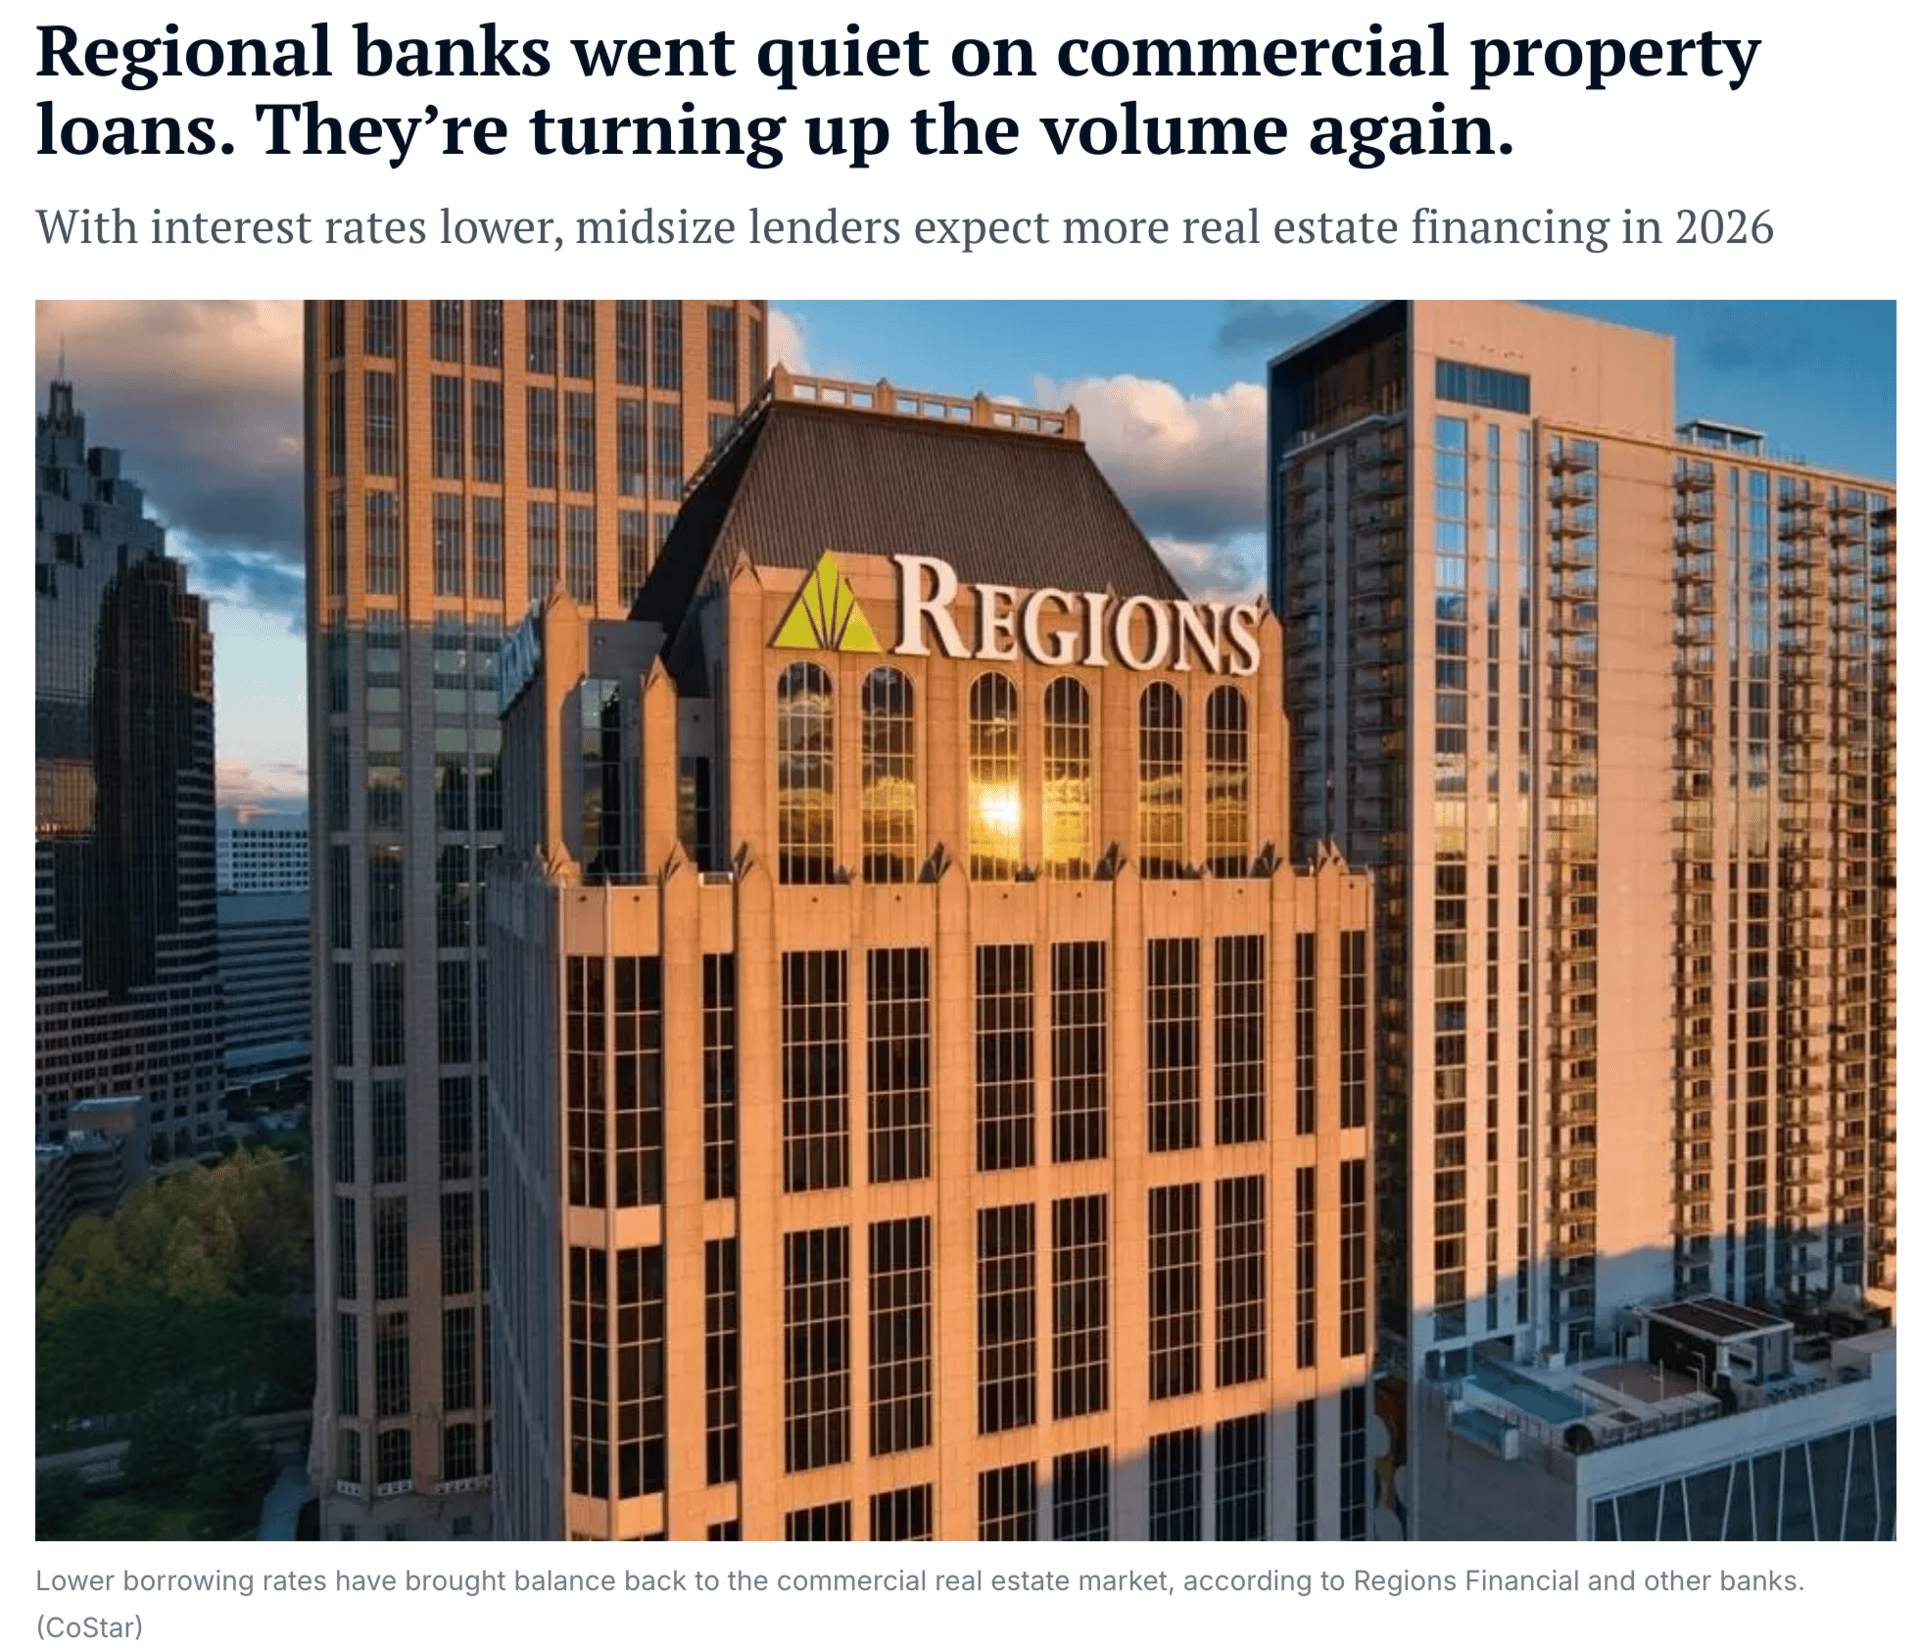
Major U.S. regional banks are projecting renewed growth in commercial real estate lending after years of reducing risk, citing lower interest rates and credit quality stabilizing across properties.
Banks including Regions Financial, PNC, M&T Bank, First Horizon, U.S. Bancorp and KeyCorp told investors during fourth-quarter earnings calls that they expect commercial lending to contribute to their portfolios in 2026.
The shift marks a potential turning point for commercial real estate finance after regional banks pulled back from the sector following the pandemic. Midsized lenders reduced exposure, as office valuations collapsed and interest rate increases made new deals uneconomical. Now, executives have said in recent days, the prospect of risk-adjusted returns signals renewed confidence.
The outlook follows Federal Reserve interest rate cuts that began in September 2024. Lower rates improved banks' ability to cover total debt payments with their operating income and made new commercial real estate projects economically viable.
"We've been very successful when things mature to be being able to refinance" commercial property loans, Regions Chief Financial Officer David Turner said on his company's earnings call. "The rate environment's helping a bit more on growth in that space."
That is particularly true in multifamily housing, where, as rates have come down, the math is starting to work, Turner added.
Regions had demanded larger down payments when rates were higher, creating friction with developers, Turner said. Lower rates, though, have brought balance back to the market.
Regions said elevated capital markets refinancing activity during 2025 constrained loan growth, but this headwind has largely passed.
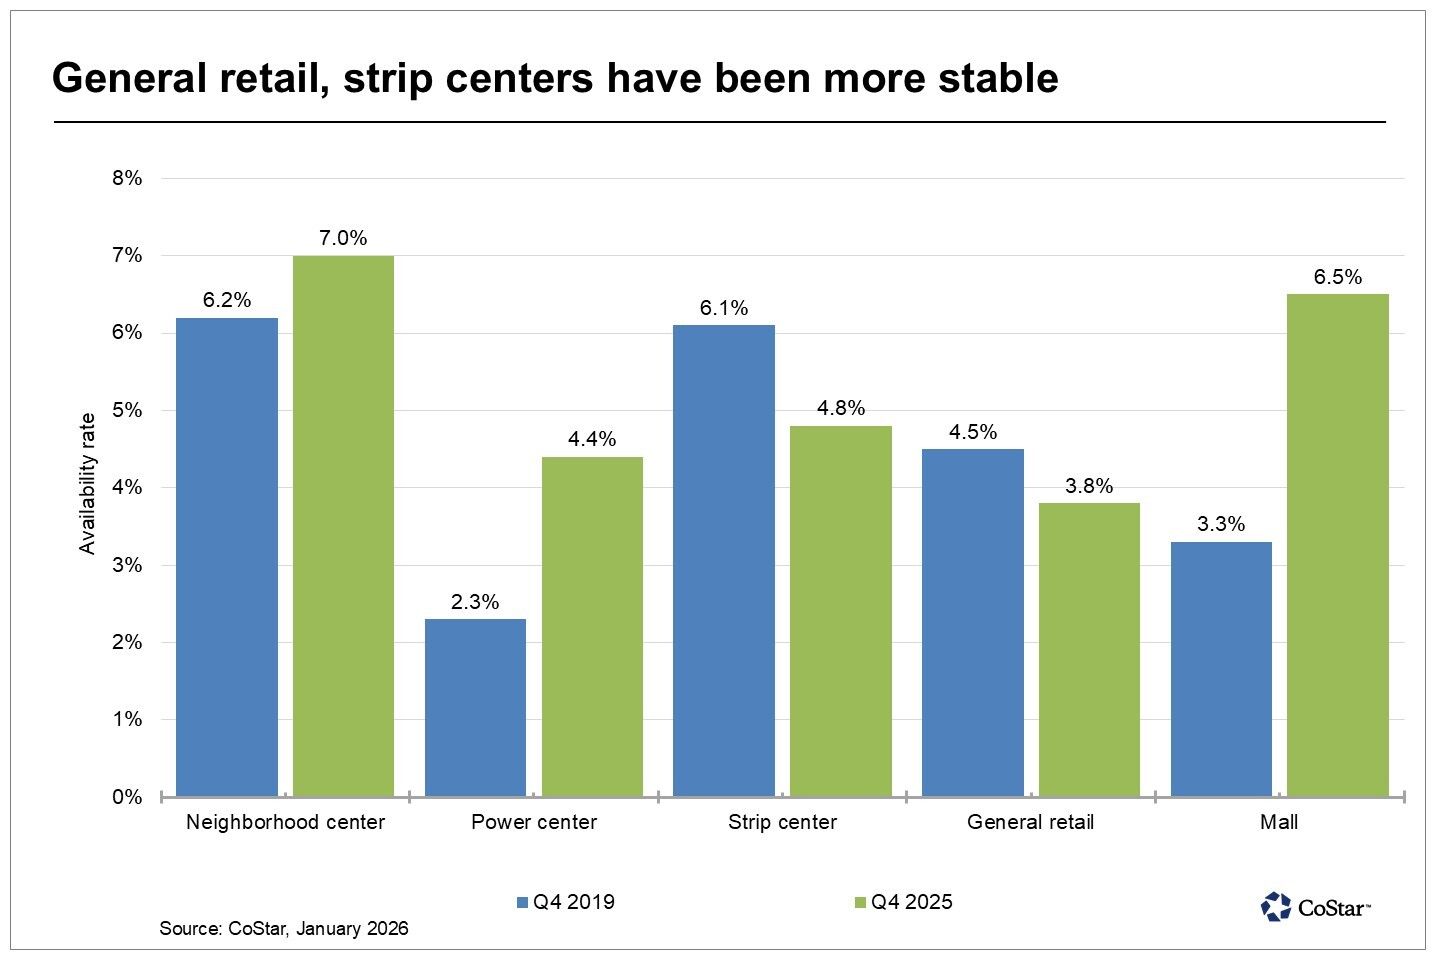
San Diego’s retail market ended 2025 with its highest availability rate since 2021. At 5.2%, it was a tick below the 10-year average. Over 1.3 million square feet was added to the leasing market in 2025, the most in a calendar year in the past decade.
Availability has loosened the most for midsize boxes in malls, neighborhood centers and power centers. Macy's, Joann, Kohls, Rite Aid and Party City were among the brands closed in 2025 from Chula Vista and Central San Diego to Vista and Escondido. Availability in each of these subtypes rose more than a full percentage point year over year in 2025, exceeding their 2019 year-end levels.
Small deals for shop space continuing to drive leasing volume, have remained stable, as the loosening availability has not spread evenly across the region. The availability rate in these two subtypes, conversely, has been trending below their pre-pandemic levels.
While the pace of move-ins improved year over year in 2025, overall negative net absorption was driven by a 30% year-over-year increase in move-outs. Over half of the negative absorption in 2025 was tied to national retailers.
Availability in San Diego's four- and five-star properties has been trending at its lowest point in a decade, running roughly 2 percentage points below the market-wide rate. In fact, high-end properties account for only 5% of all available space in the region.
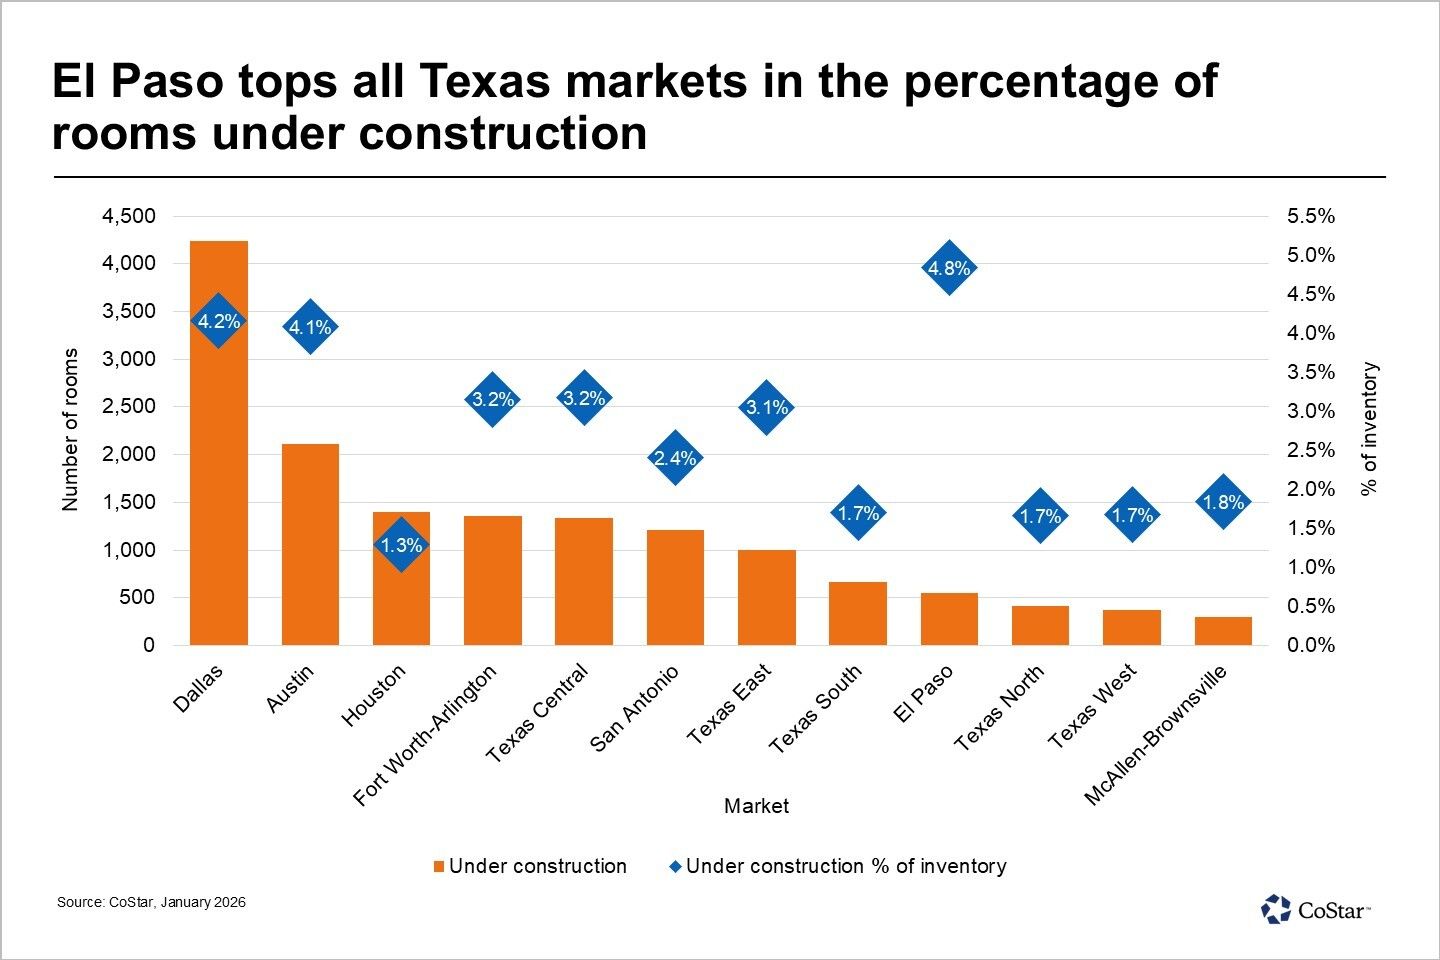
Texas has nearly 15,000 rooms under construction across its major metropolitan areas and regional markets, with development most concentrated in Dallas, Austin and Houston.
Texas Central, the East Texas region and El Paso, are also experiencing significant activity. El Paso leads Texas in the share of hotel rooms under construction relative to its existing inventory at 4.8%. New development is driven primarily by upscale and upper-midscale projects, with a strong emphasis on extended-stay properties, which have continued to define the market’s recent room expansions over the past few years.
Dallas ranks first statewide with 4,244 rooms under construction. Austin follows with 2,111 rooms now being built. 1,399 hotel rooms under construction in Houston, 1,360 in Fort Worth-Arlington and ongoing development in San Antonio, all contributing to continued urban growth in Texas’ largest metropolitan areas. Regional hubs are also making meaningful contributions to the pipeline, including 1,453 rooms in Texas Central and 668 in Texas South.
By hotel class Mid-tier segments, particularly upper-midscale and upscale, continue to represent the bulk of hotel development in Texas. These categories represent roughly 66% of the statewide pipeline, or about 9,980 rooms now under construction. Luxury and upper‑upscale projects account for roughly 22% of total activity.
Invitation Homes—one of the largest institutional landlords, which wholly owns 86,139 single-family rentals—announced Thursday that it has acquired ResiBuilt, a Southeast-focused build-to-rent (BTR) developer, for $89 million. Atlanta-based ResiBuilt has delivered more than 4,200 homes since its founding in 2018 and operates across Georgia, Florida, and the Carolinas. The transaction includes 23 existing fee-build contracts and a pipeline of additional third-party development opportunities. Invitation Homes also secured options on approximately 1,500 lots. The development here isn’t that Invitation Homes is adding new-build homes to its portfolio—it has been executing bulk deals with homebuilders for years—but that it is now moving upstream by creating its own in-house homebuilder via its acquisition of ResiBuilt, a build-to-rent developer.

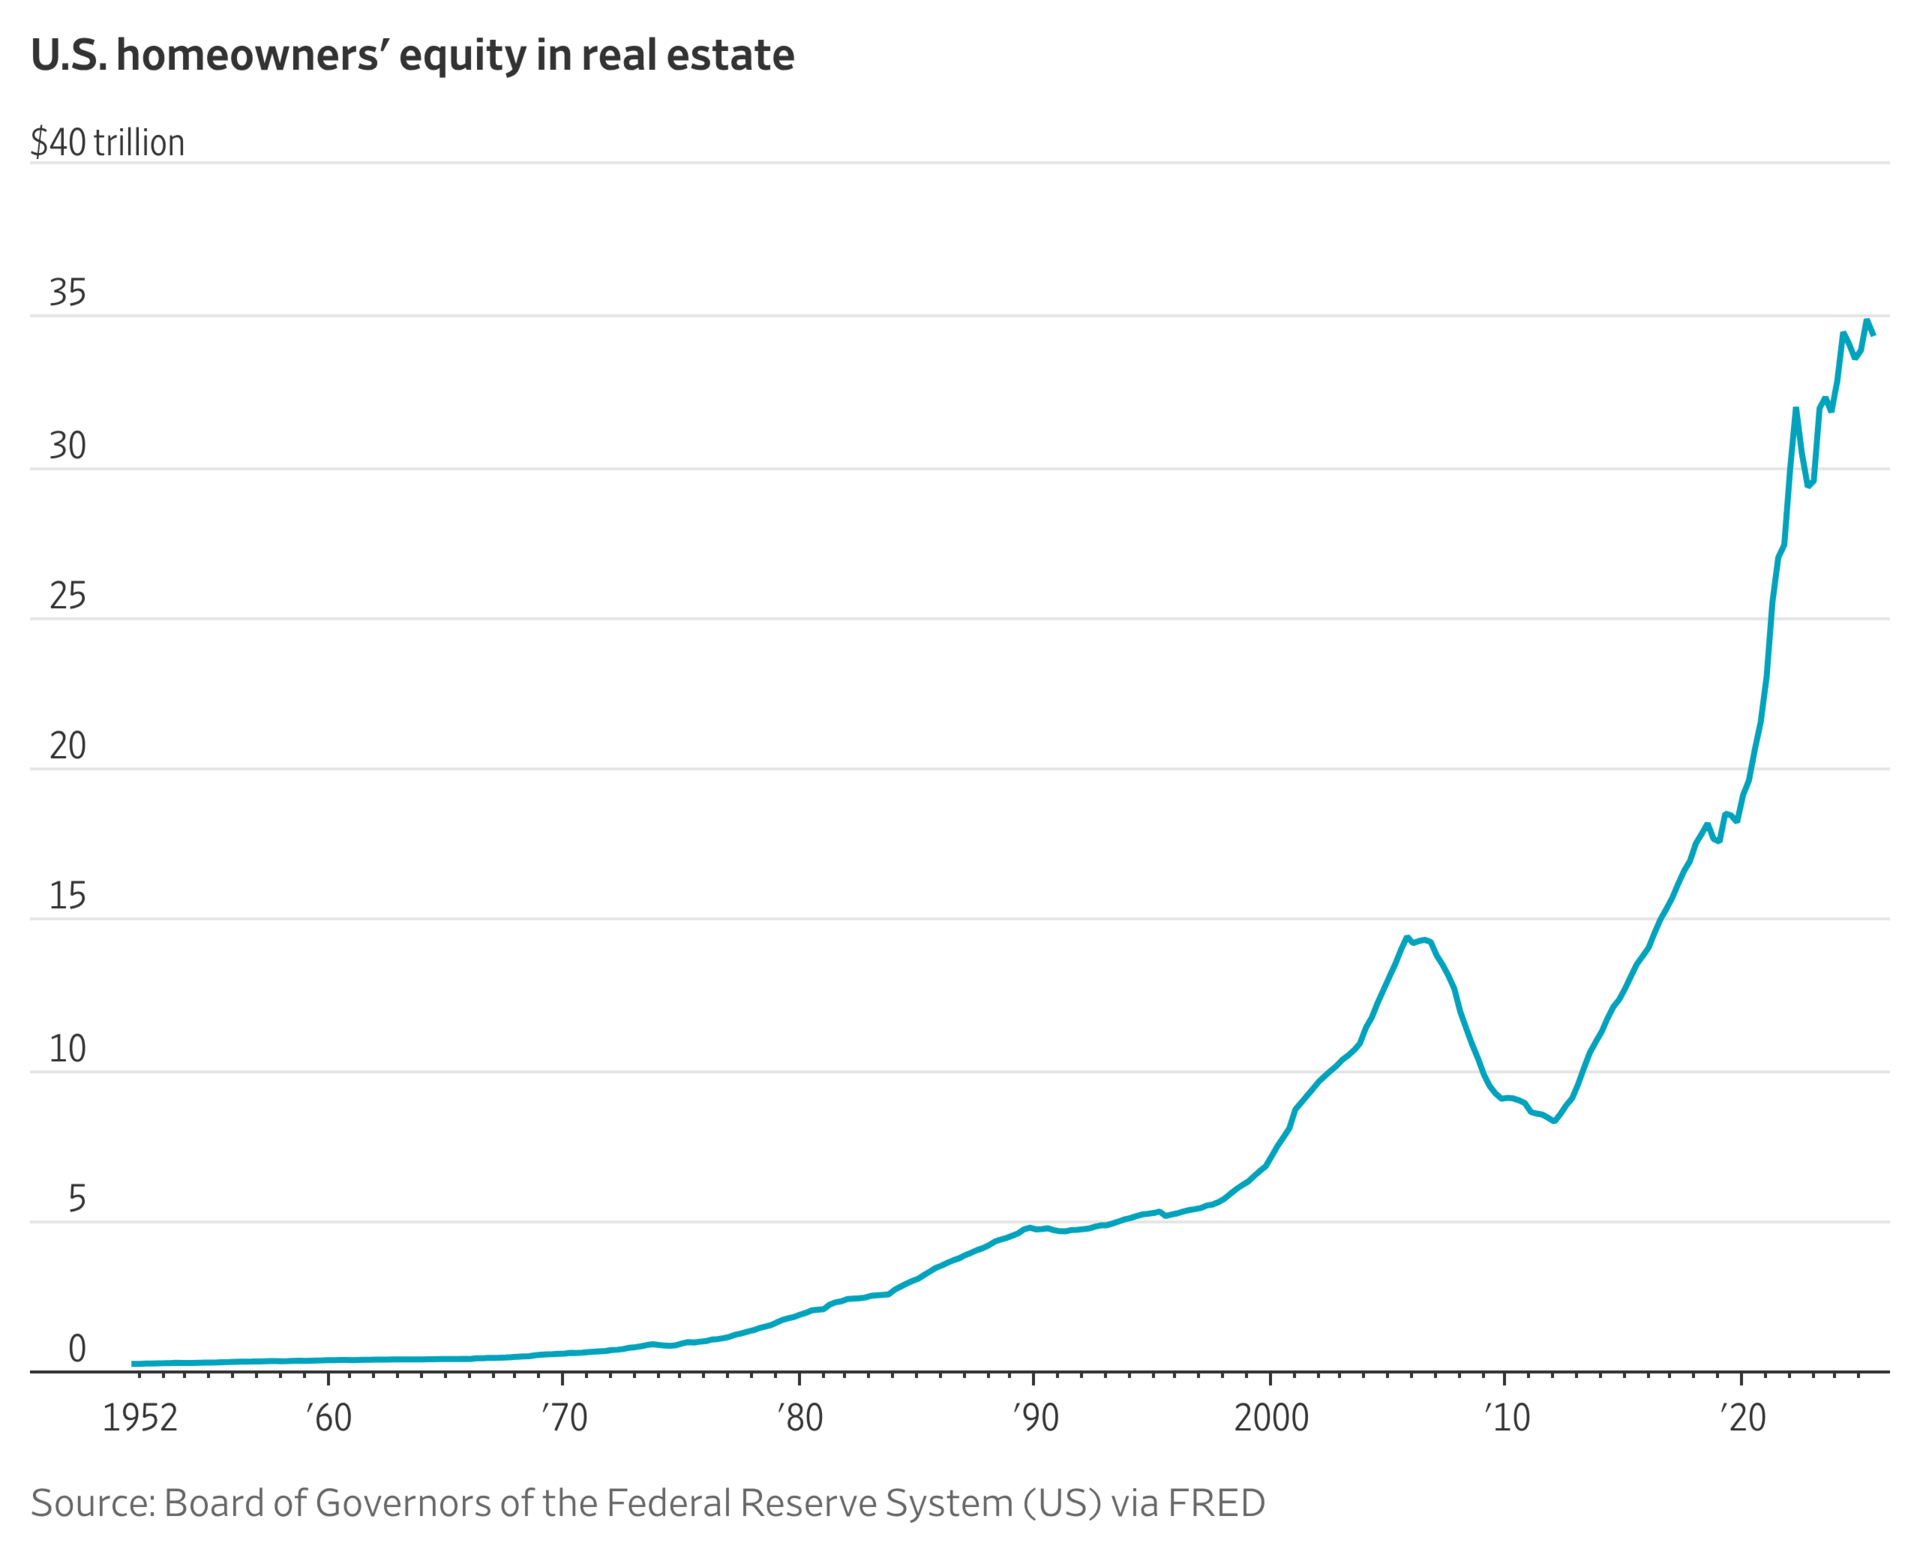
Trapped renters want home prices to fall so they can finally get onto the property ladder. Millions of existing owners want values to stay high. These and other conflicting interests make it hard for policymakers to give young Americans a leg up in a brutal housing market.
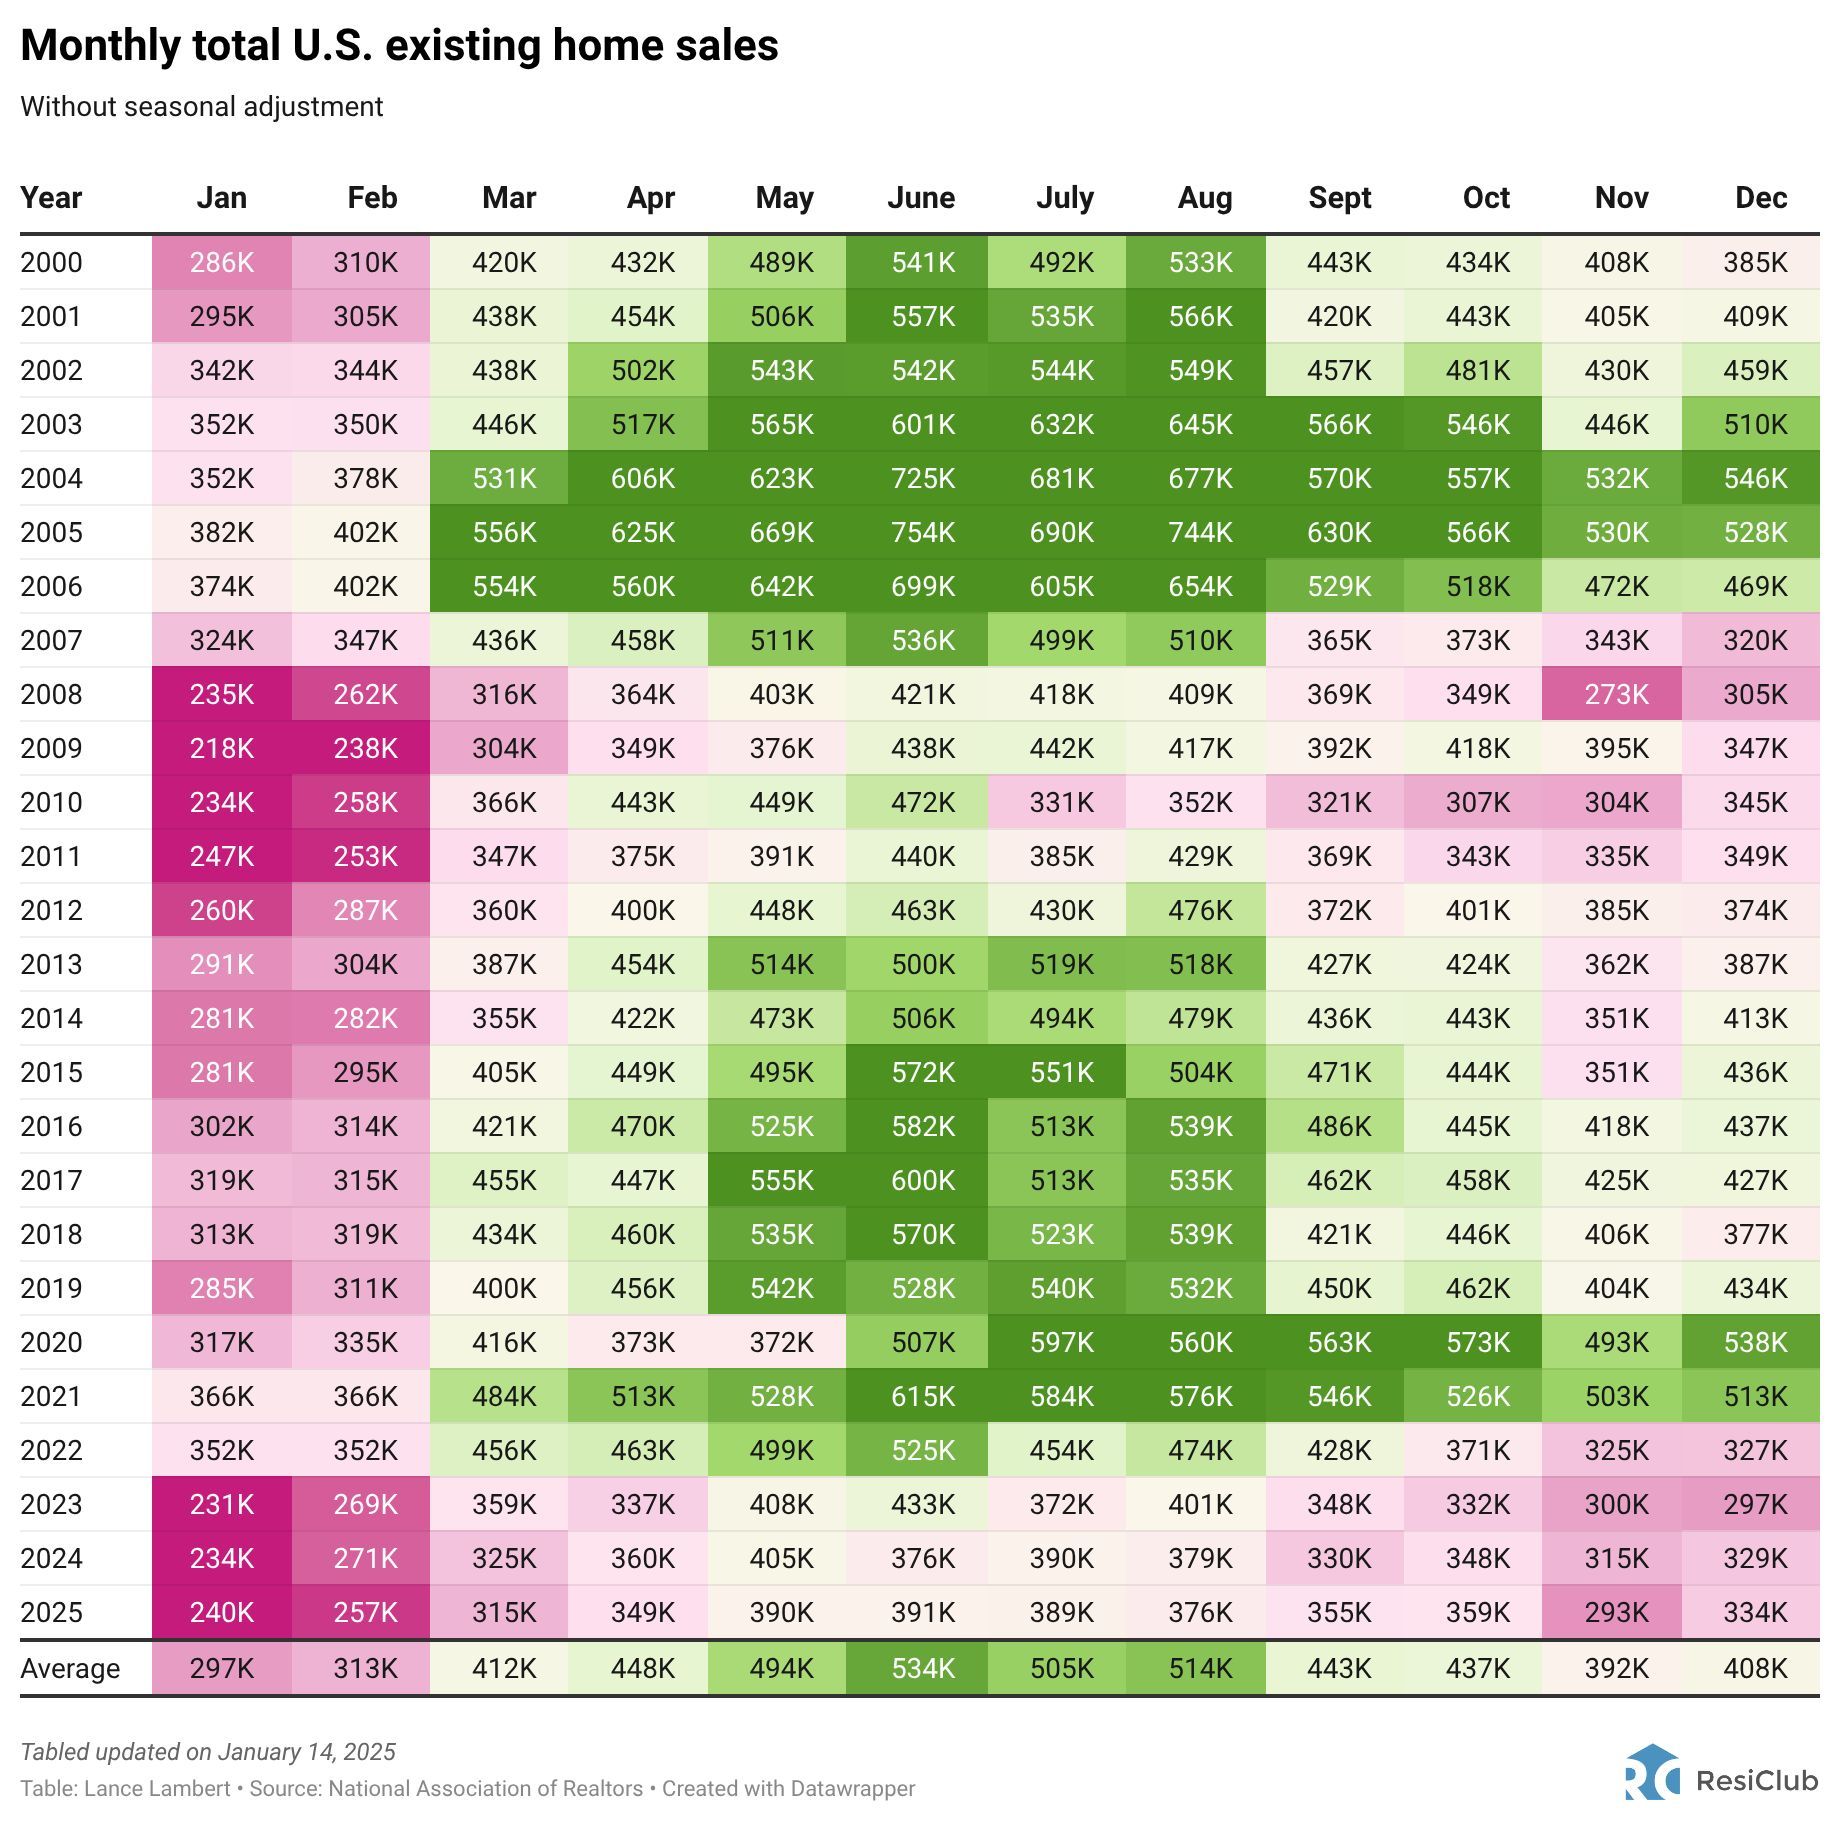
U.S. existing home sales totaled 4.06 million in calendar year 2025. That's tied for the lowest year since 1995—and essentially flat from 2023 (4.09M) and 2024 (4.06M). On a seasonally adjusted annualized basis, U.S. existing home sales are now running at 4.35M... meaning, if we maintain the current rate of existing home sales—and seasonality acts as expected—we'd see slightly more existing home sales in 2026 than we saw in 2025.
This graph based on data from Altos Research shows that active inventory of single-family homes, as of January 16th, was up 10.1% YoY compared to the same week in 2025. This will be important to track, and it is possible inventory bottomed very early this year. The significant pickup in inventory usually happens in March.

The Mortgage Purchase Application Index at the second week of January, by year:
January 2018 —> 249.2
January 2019 —> 278.5
January 2020 —> 303.9
January 2021 —> 338.9
January 2022 —> 305.7
January 2023 —> 201.0
January 2024 —> 162.2
January 2025 —> 162.0
January 2026 —> 184.6
Zoomed out, mortgage purchase applications are starting 2026 in ‘historically soft’ territory (bottom 25th percentile). However, they’re now approaching the bottom threshold (188.9) for ‘historically normal’ purchase apps levels (25th–75th percentile). Historically, mortgage purchase applications have been a leading indicator of U.S. existing-home sales. Current purchase application data suggest sales could rise a little in 2026 relative to 2025. But even with a small uptick this year, resale turnover would still remain at constrained levels.

Austin, Texas is the strongest buyer's market in America with home sellers outnumbering homebuyers by 128%.

