- Location Strategy Chartbook
- Posts
- Location Strategy Chartbook 02.07.2026
Location Strategy Chartbook 02.07.2026
Real Estate Market Insights
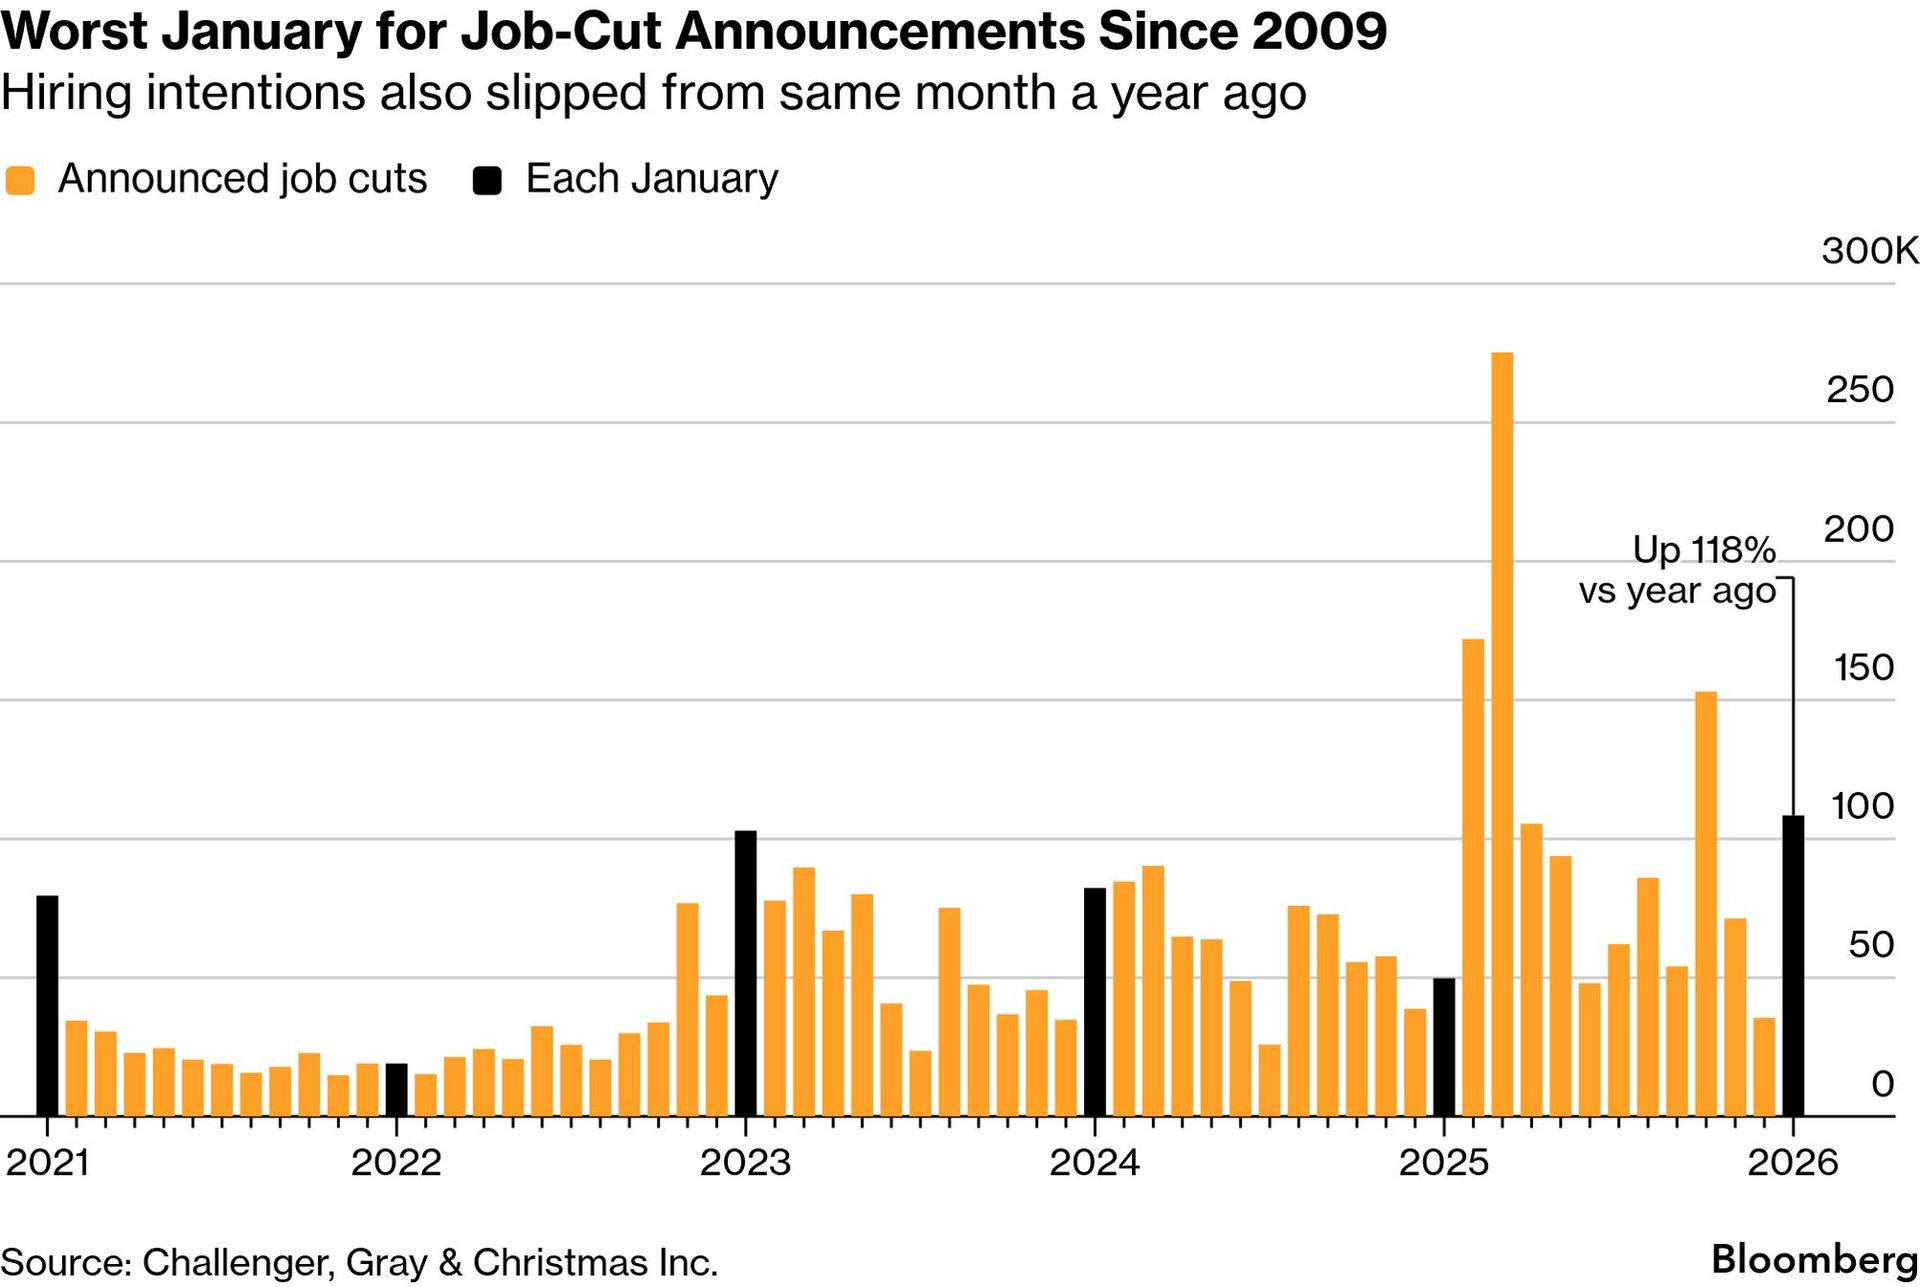
US companies announced the largest number of job cuts for any January since the depths of the Great Recession in 2009, according to data from outplacement firm Challenger, Gray & Christmas.
Companies last month announced 108,435 job cuts, a 118% increase from a year earlier. The report on Thursday also showed hiring intentions slid 13% from a year earlier to 5,306—marking the weakest total for any January in the firm’s records back 17 years.
“Generally, we see a high number of job cuts in the first quarter, but this is a high total for January,” said Andy Challenger, the company’s chief revenue officer. “It means most of these plans were set at the end of 2025, signaling employers are less-than-optimistic about the outlook for 2026.”
Almost half of the job cuts announced in January were tied to three companies—Amazon, United Parcel Service and Dow. Amazon announced plans to cut 16,000 corporate positions while UPS said it would shed as many as 30,000. Chemical maker Dow intends to eliminate about 4,500 positions, while Peloton Interactive and Nike also announced mass dismissals.
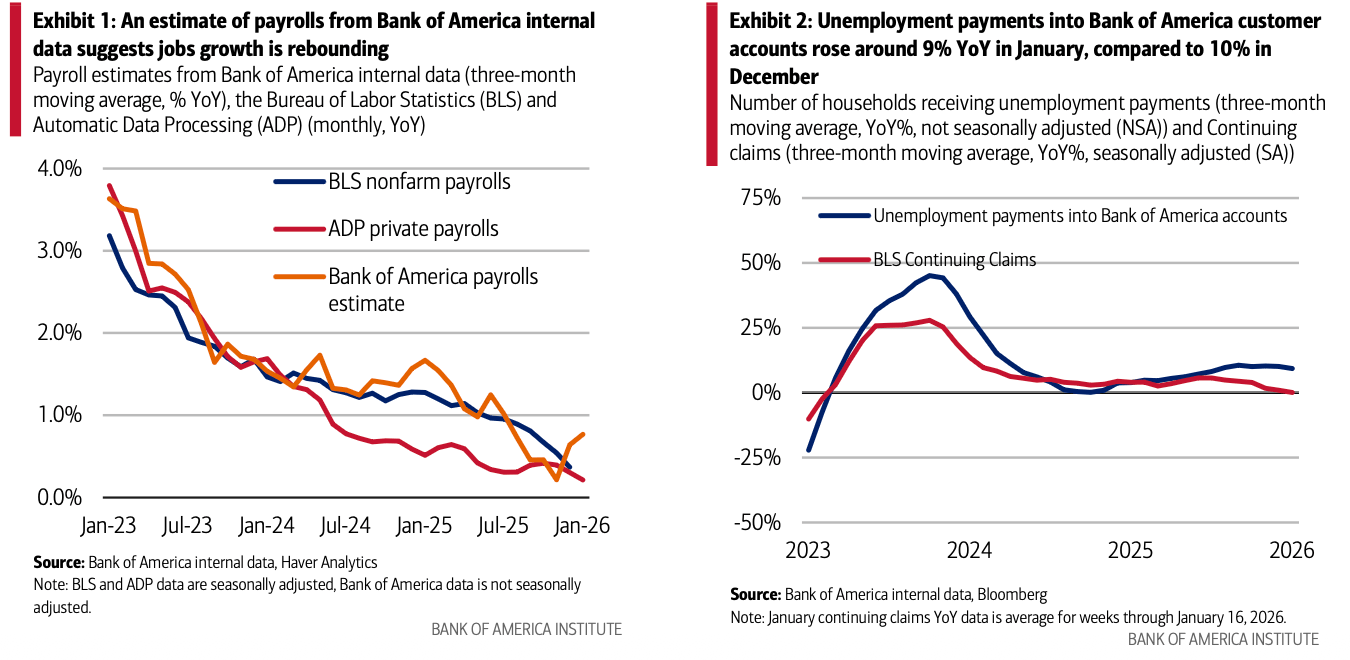
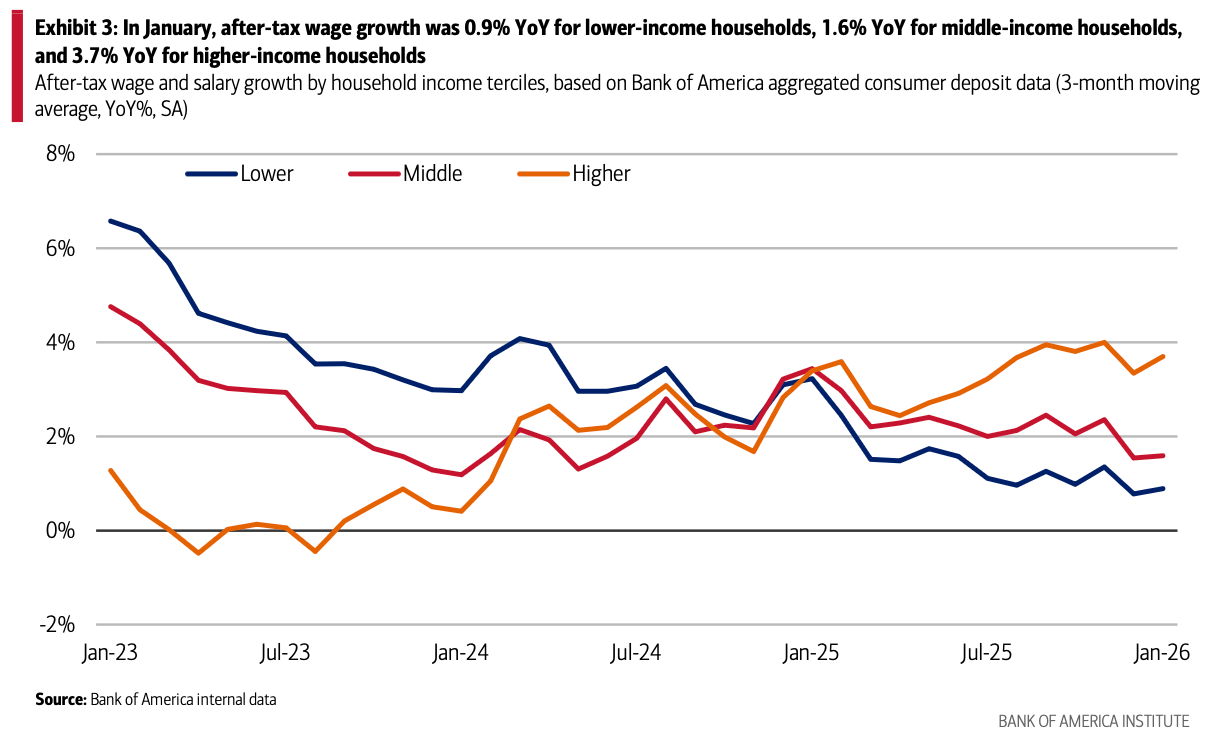
According to Bank of America internal deposit data, there remains a large gap between the after-tax wage and salary growth of higher- and lower- income households. In January, higher-income households' after-tax wage and salary growth was 3.7% YoY,
while for lower income households it was 0.9% YoY.
Middle-income households' wage growth, in our view, deserves close attention. These households' after-tax wage growth was 1.6% YoY in January 2026, tracking below the average of 2.0% YoY seen over the second half of 2025. This relative softness
may unwind, but if it persists it may lead to downside risks to consumer spending once the expected lift from tax refunds is over
The United States population is growing at its slowest rate since the height of the coronavirus pandemic, according to recently released U.S. Census Bureau estimates.
While that pace is set to ease further across the country, this structural slowdown is likely to amplify post-COVID regional population shifts to lower-density Southern and Western states, with implications for job and housing markets.

The 1.8 million people added between July 2024 and June 2025 represented a 0.5% growth rate. That's a significant drop from the unusually fast growth of 1% in 2024, and slower than what occurred during the years prior to the pandemic, when annual population growth averaged 0.7% each year between 2011 and 2019.
A sharp drop in immigration was the primary driver of the slowdown. However, the full impact of the Trump administration’s tighter migration policies and more aggressive deportations likely won’t show up in these data until the coming years.
Net immigration fell by more than half to 1.3 million from a modern high of 2.7 million the year prior. That’s still 45% higher than the pre-pandemic annual average of around 870,000. However, if monthly trends since January 2025 continue, the Census Bureau projects net immigration to fall to 321,000 in the year ending with June 2026, which would be lower than even 2021, with potentially net negative immigration in the years to follow.

Though international immigration to the South fell by nearly half through 2025, net domestic migration remained positive, helping the region maintain its status as the fastest-growing in the country. Still, the 0.9% growth rate in 2025 was down from 1.4% in 2024 and below the pre-pandemic average of 1% growth from 2011 through 2019.
The pace of net domestic migration slowed in the South as well, falling 10% year-over-year to levels about 12% below pre-pandemic averages. The most notable declines came in the largest states. Domestic migration to Florida fell more than 60% in 2025 to just 22,500, while domestic migration to Texas fell 22% to 67,000.


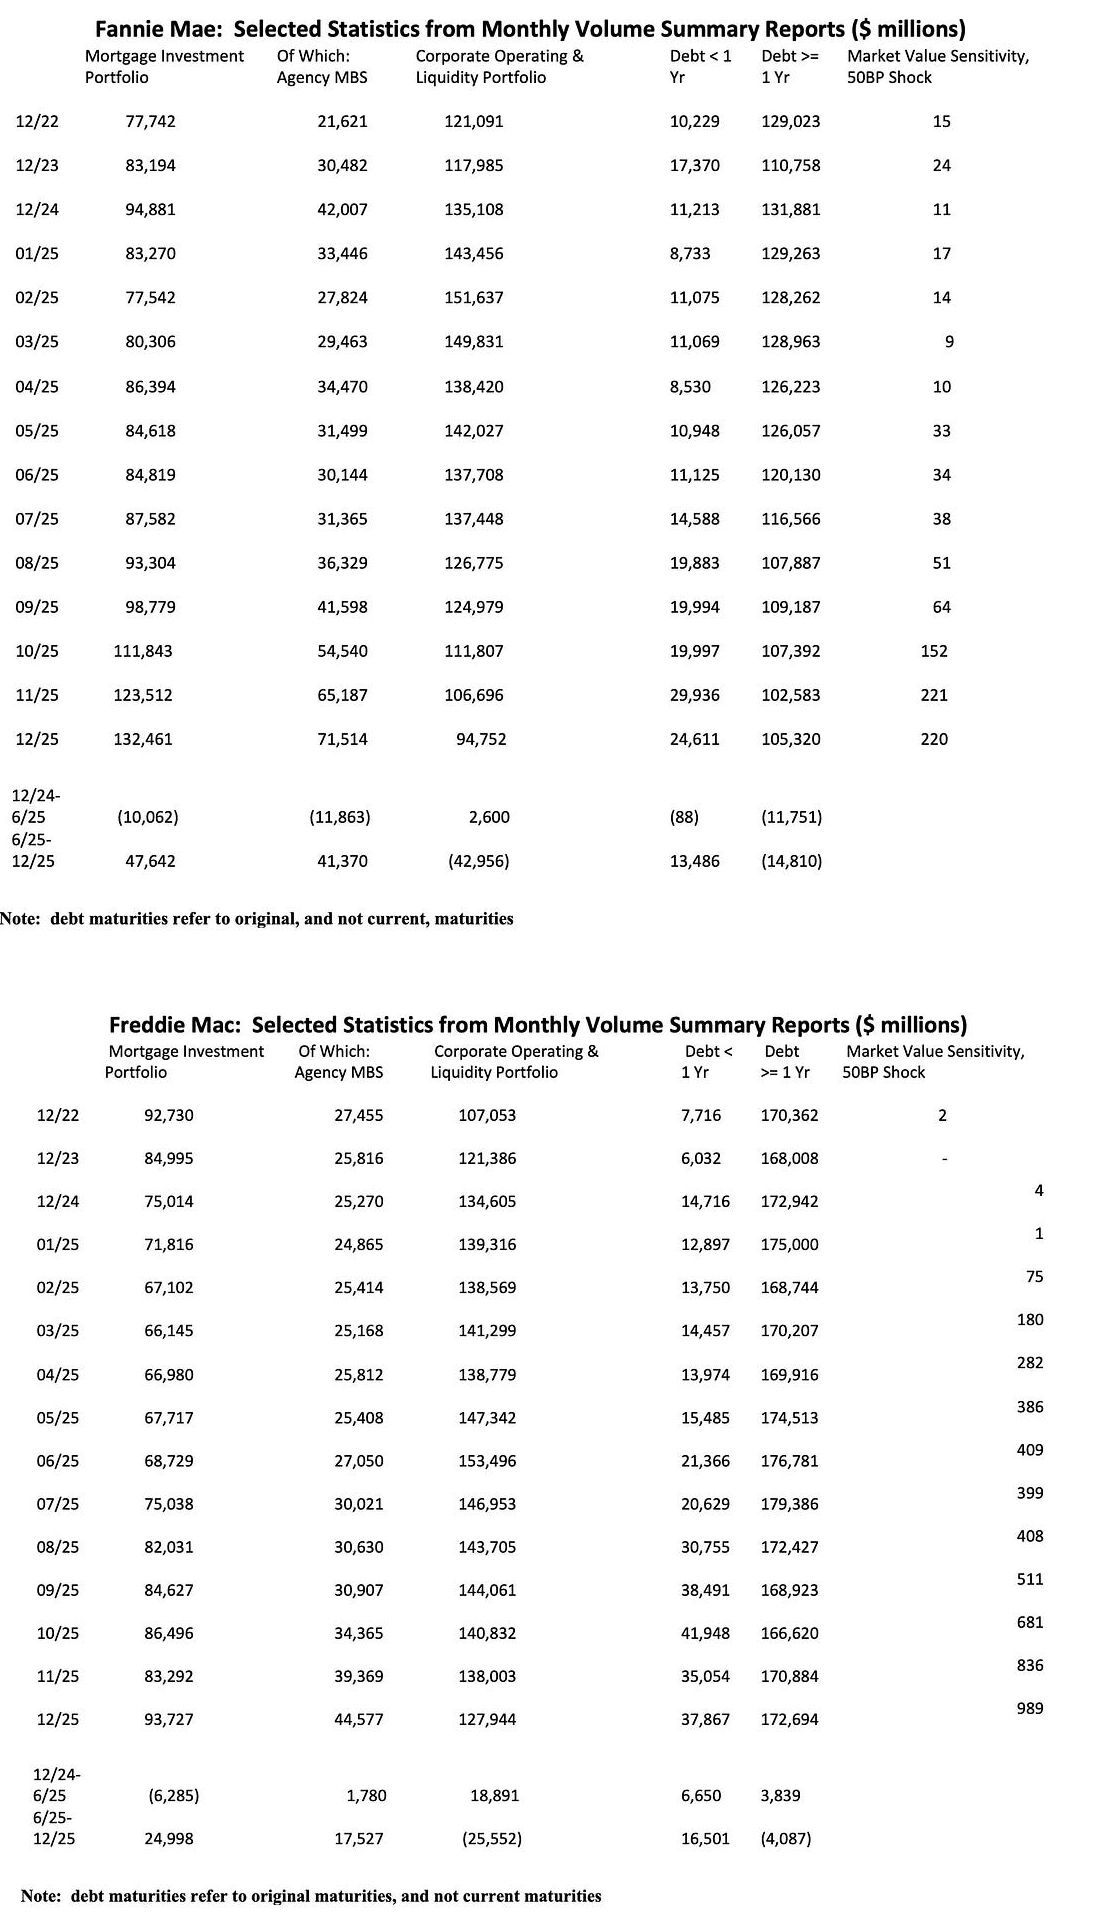
Economist Tom Lawler: Last week Fannie Mae and Freddie Mac released their monthly volume summary reports for December, the last monthly report ahead of the president’s January 9th post that the GSEs will buy $200 billion in MBS.
Combined they increased their Agency MBS holdings by about $59 billion in the second half of last year, and decreased their “corporate operating and liquidity” (COL) portfolios by about $69 billion. These figures suggest that the “cash” used to fund the increased Agency MBS holdings came from either runoff or sales from their COL portfolios, much of which are comprised of short-term securities.
This does not mean, of course, that the GSEs “replaced” short-term assets with longer-term assets without “hedging” the obvious interest-rate risk that would entail.Both GSEs use derivatives (e.g., interest rate swaps and to a lesser extent swaptions) to manage the interest rate risk of their mortgage investment portfolios, and presumably that continued in the second half of last year (the monthly volume summaries do not include data on derivative activity, though they contain some information about interest-rate risk).
One might assume that the GSEs have in fact “funded short” some of their recent MBS purchases, given that the market value exposures of both GSEs (especially Freddie Mac) to a 50bp shock to interest rates have increased significantly over the last year. However, that increased market-value sensitivity appears to stem almost completely by decisions by the GSEs (especially Freddie Mac) to increase the maturities/durations of their COL portfolios – in part, apparently, to reduce earnings volatility. For example, based on Freddie Mac’s monthly volume summary report it appears as if the duration of their COL portfolio went from about zero at the end of 2024 to about 28 months at the end of 2025. (There is no information on the duration of Fannie Mae’s COL in its monthly report0.
At the end of last year the combined GSEs COL portfolios totaled $222 billion, down from $292 billion at the end of June of last year. Given regulatory and GSE policies on liquidity management, it is unlikely that the GSEs will reduce their COL portfolios by all that much next year. As such, if the GSEs were to increase their agency MBS purchases by $200 billion over the next, say, several months, the GSEs are almost certainly going to have to ramp up debt issuance. Whether that will be in the form of shorter-term or longer-term debt issuance is unclear. Last year Fannie Mae’s gross issuance of debt with an original maturity exceeding one year was just $30.2 billion and maturities totaled $56.8 billion, while Freddie Mac’s gross issuance was $138.6 billion and maturities totaled $138.7 billion. It is unclear whether the “appetite” for longer-term GSE debt is sufficient to accommodate the sizeable implied increase in GSE longer-term debt issuance with having at least some impact on GSE debt spreads.
In all likelihood the GSE will also have to ramp their short-term debt issuance, and also ramp up their use of interest-rate swaps (especially pay-fixed swaps) in order to manage the interest rate risk association with a $200 billion increase in their Agency MBS portfolios.
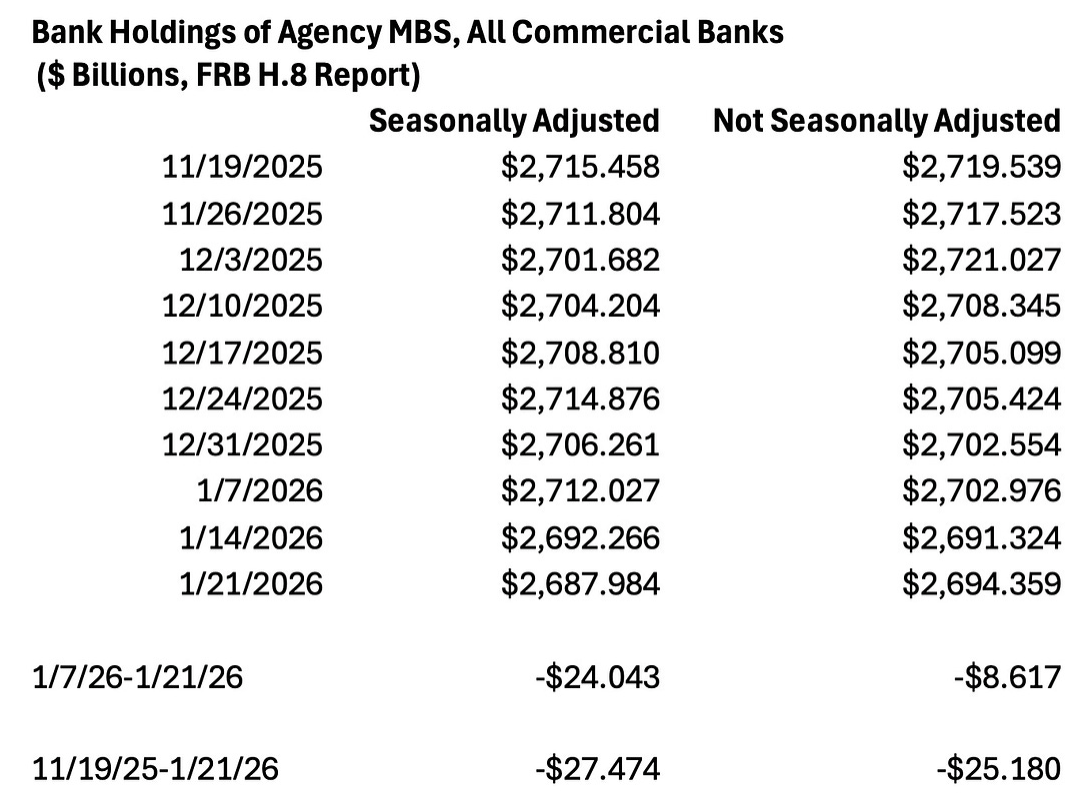
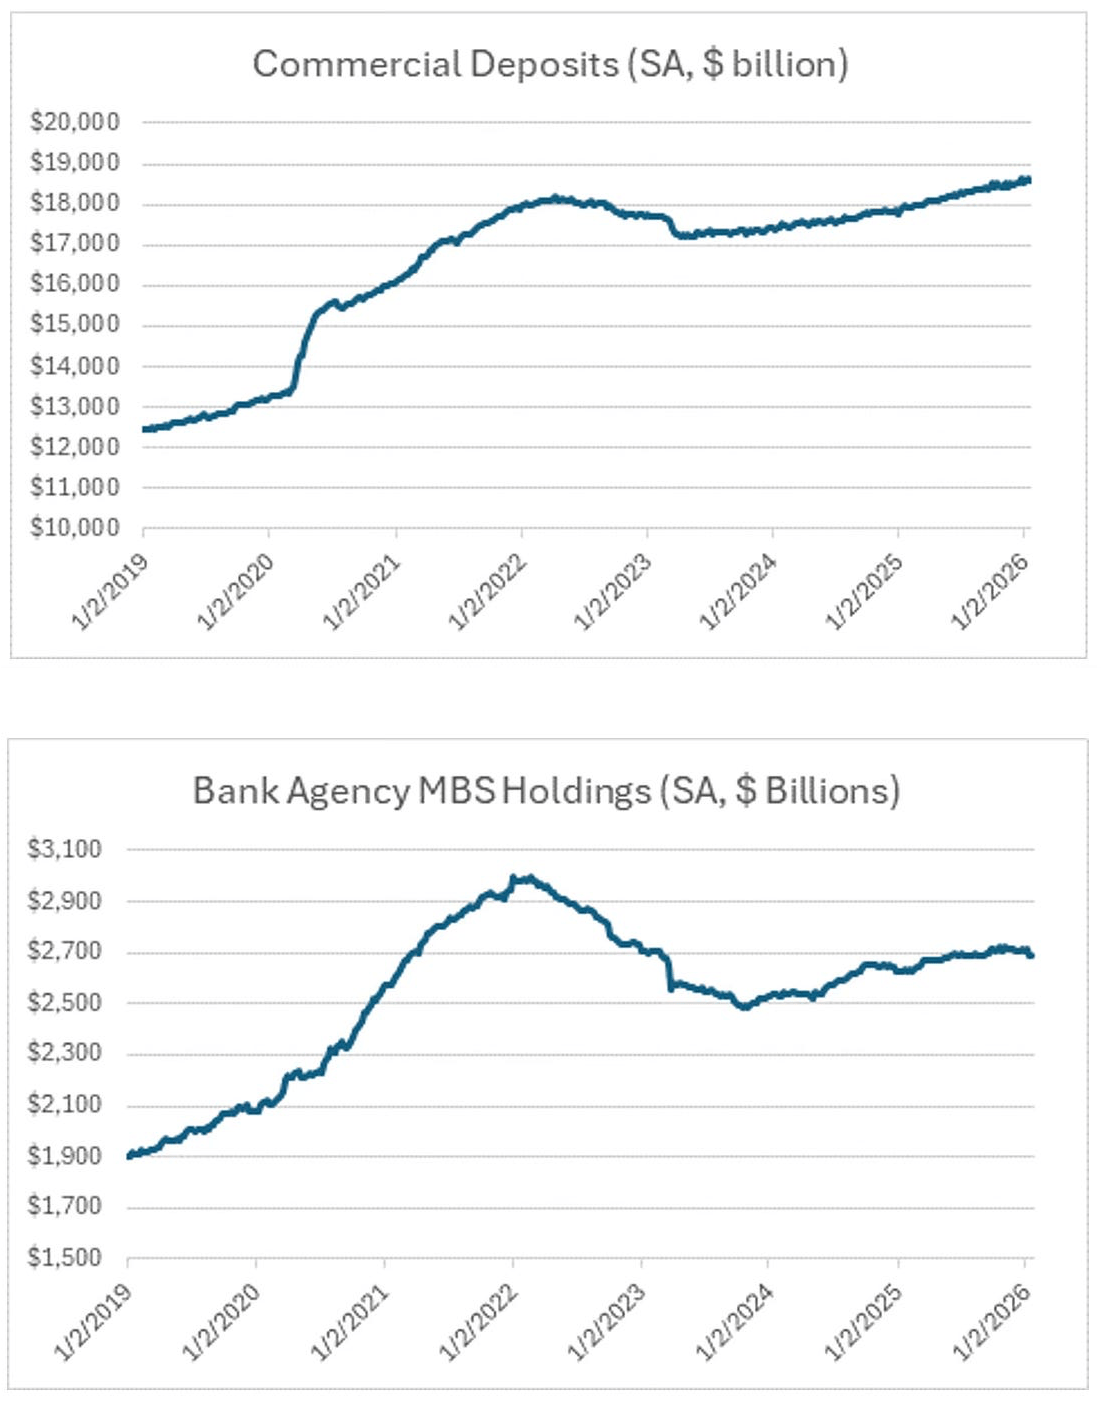
Commercial Banks as a class are the largest holders of agency MBS, and as such many folks are focused on how commercial banks may react to the sharp reduction in agency MBS/Treasury spreads (both nominal and option-adjusted) since Trump’s January 9th post that GSEs would be buying $200 billion of MBS.
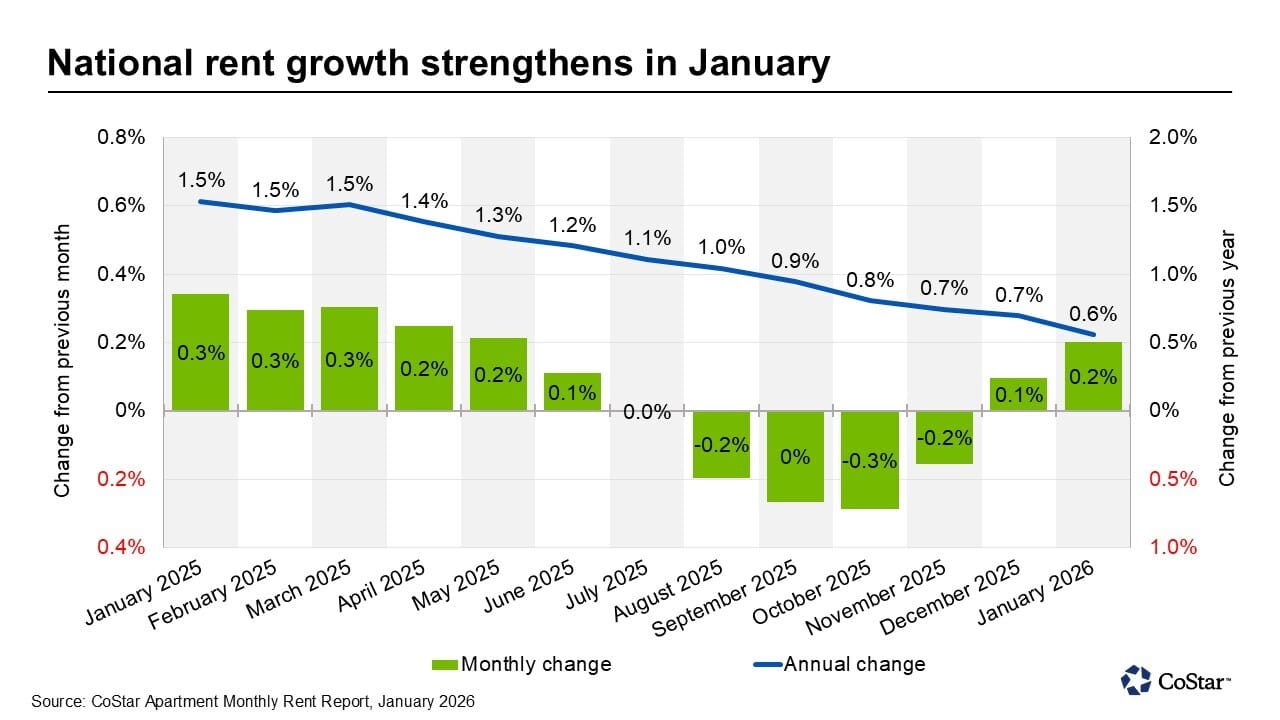
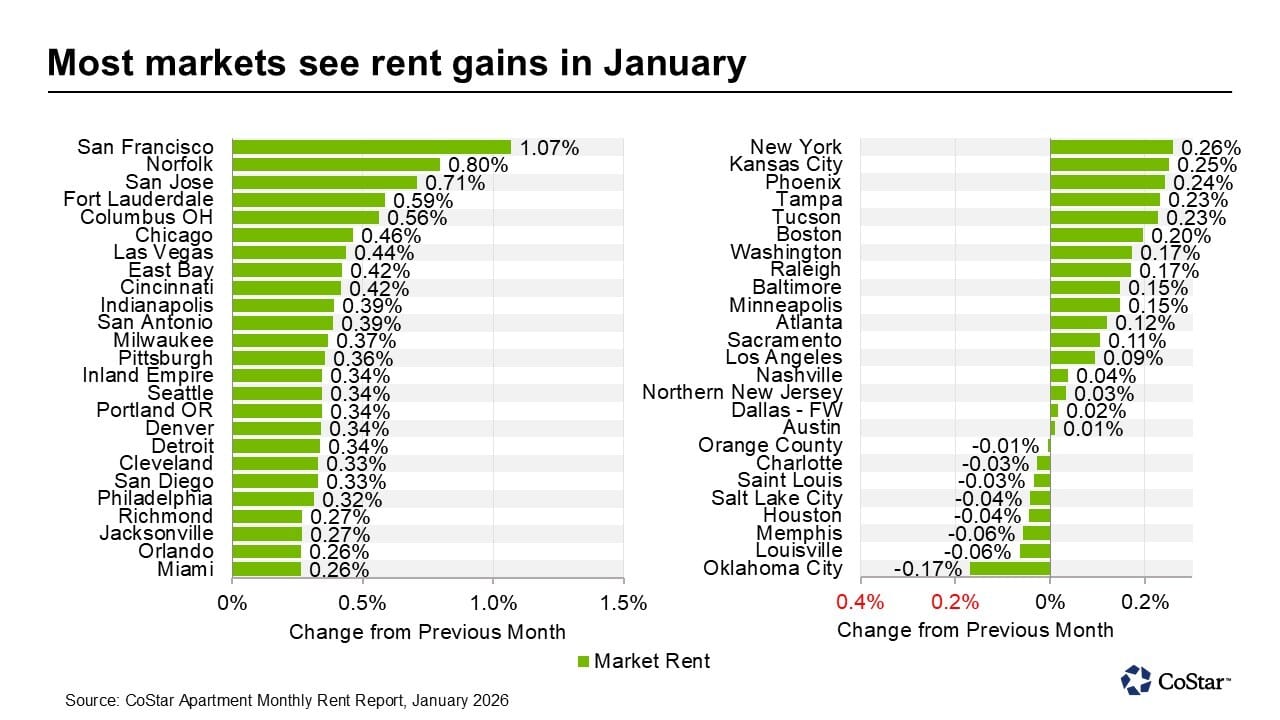
Average monthly apartment rents in the U.S. edged higher in January, extending the modest rebound that began in December following several months of no growth or rent declines in the second half of 2025.
The national average rent increased to $1,713, a 0.2% month‑over‑month gain from December’s revised average of $1,709. The January year-over-year increase was 0.6%, slightly lower than the 0.7% gain in December and down from the 1.5% average annual increase one year earlier.
The easing rent increase in January suggests that, while supply pressures remain elevated, the softness of late summer and early fall observed in 2025 continues to moderate as the market enters the early part of 2026.
Historically, rents in January build on December gains, when apartment rents begin to increase following the annual seasonal trough. January’s data largely followed that historical pattern, despite more pronounced rent moderation during the back half of last year.
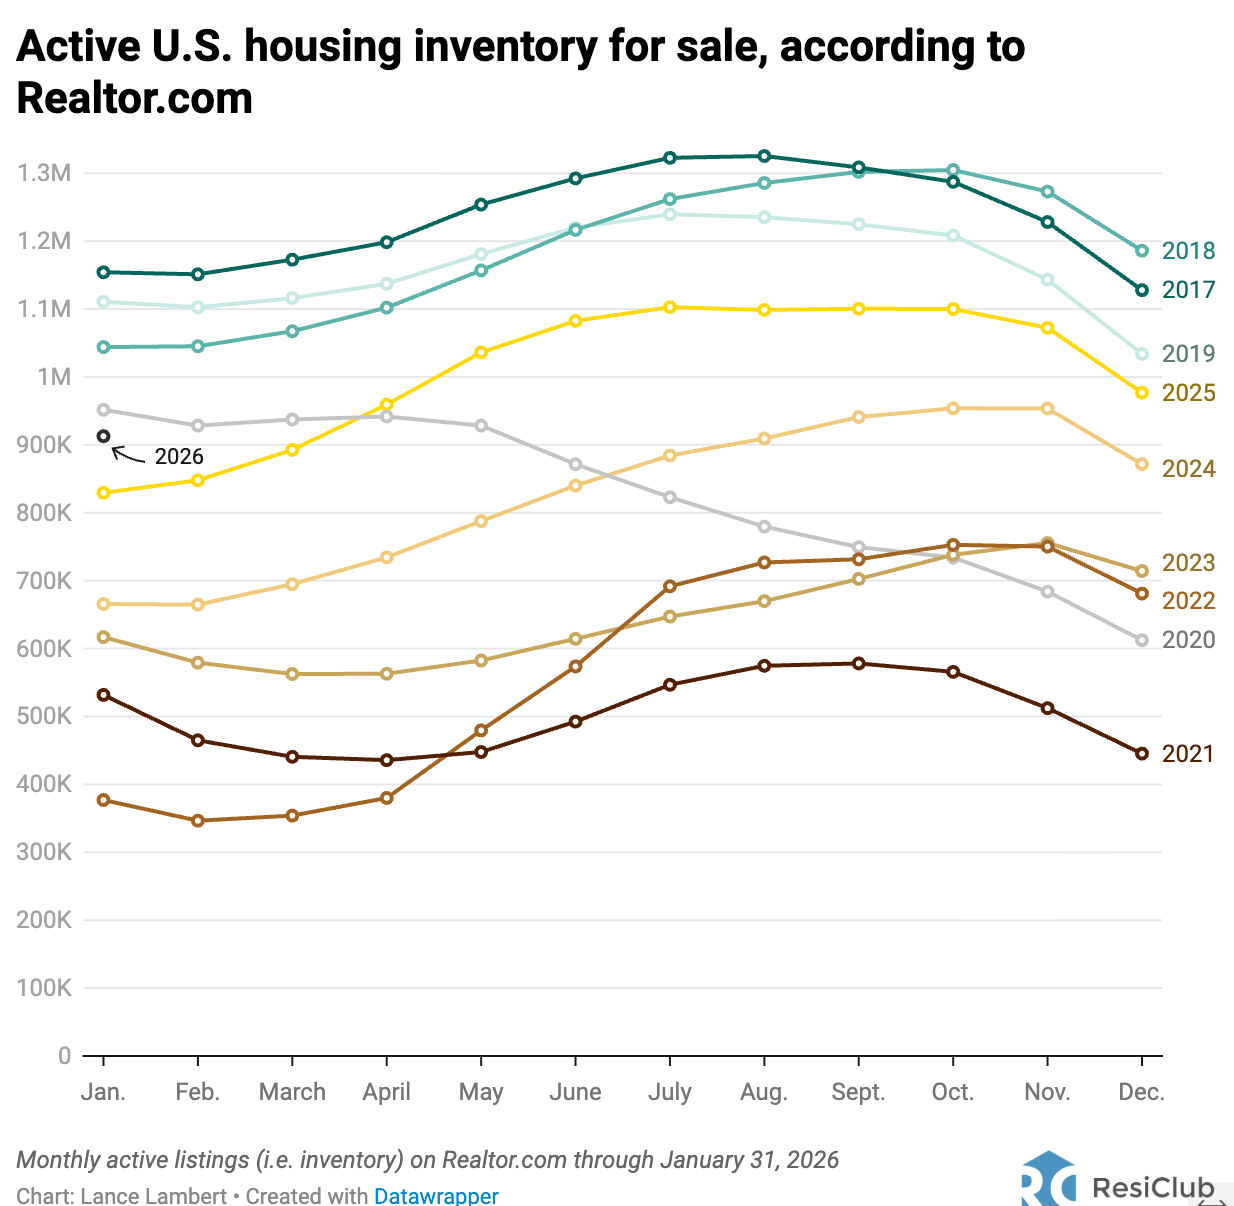
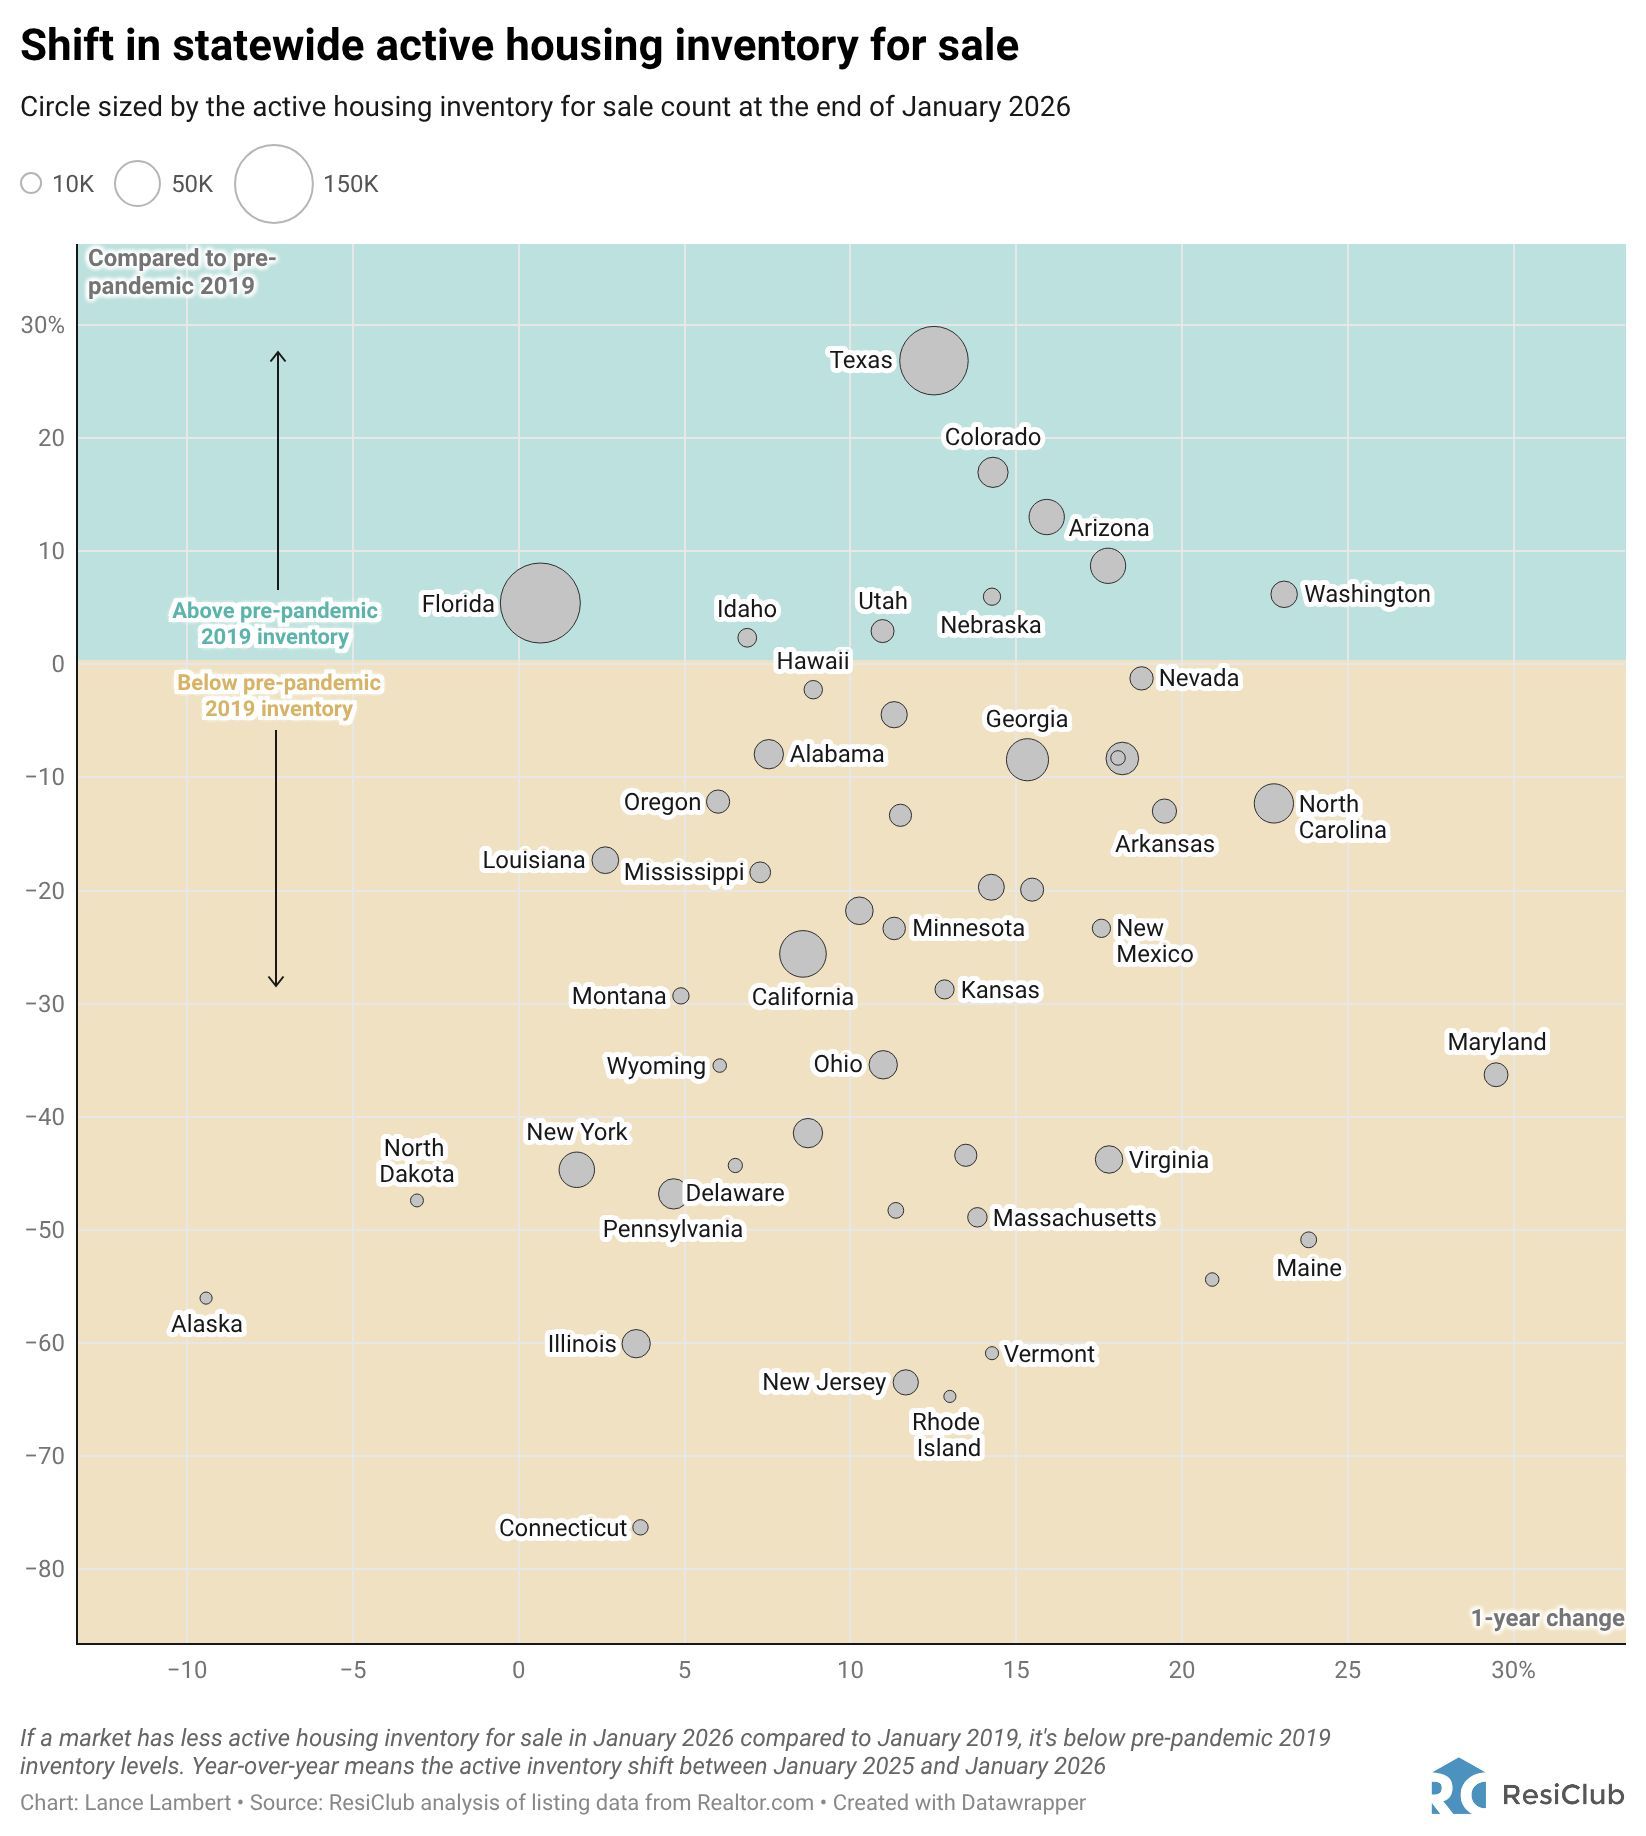
National active listings are on the rise on a year-over-year basis (+10.0% between January 31, 2025 and January 31, 2026). This indicates that homebuyers have gained some leverage in many parts of the country over the past year. Some sellers markets have turned into balanced markets, and more balanced markets have turned into buyers markets.
Nationally, we’re still below pre-pandemic 2019 inventory levels (-17.8% below January 2019) and some resale markets, in particular chunks of the Midwest and Northeast, still remain, relatively speaking, tight-ish.