- Location Strategy Chartbook
- Posts
- Location Strategy Chartbook 02.14.2026
Location Strategy Chartbook 02.14.2026
Real Estate Market Insights
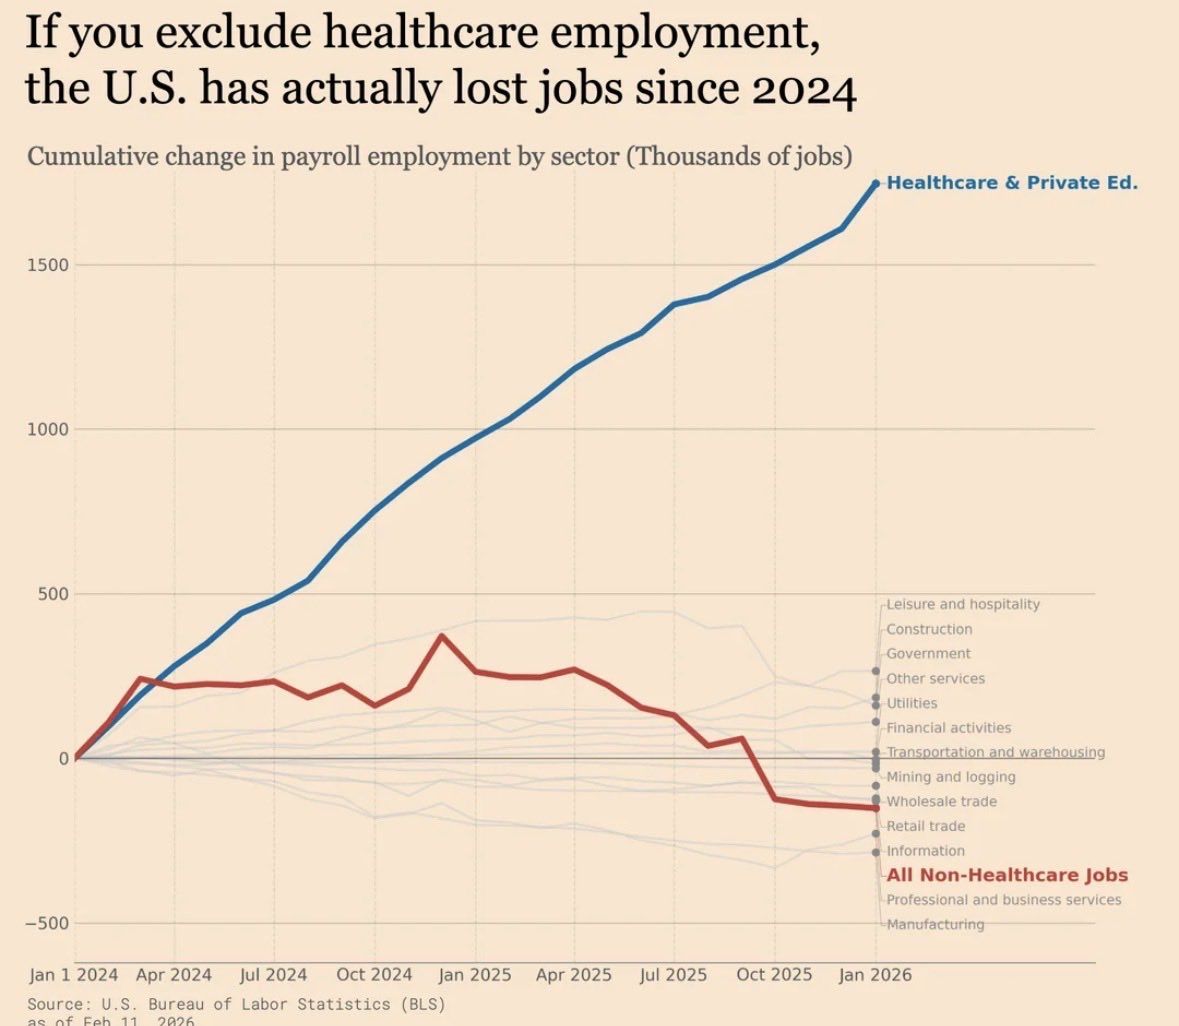
FT: The US economy added 130,000 jobs in January, beating market expectations, in a sign of improvement in the American labour market that flies in the face of a string of recent gloomy reports.
Citi’s econ team: Strong January data does not change our view that the labor market continues to gradually weaken and that the unemployment rate is still likely to climb modestly higher this year. Risks remain towards an even larger rise in unemployment if layoffs pick-up more significantly. Indeed, the reason for our stronger January forecast was due to technical factors of substantial residual seasonality, not a fundamental improvement in demand for labor. Typically, activity and employment fall substantially in January after the holiday period, with a very positive seasonal adjustment to employment data. As hiring and labor market churn are already very low, this decline in January is smaller than usual and the adjustment too positive.
Liz Ann Sonders, Schwab: Prime-age labor force participation rate rose to 84.1% in January ... highest since March 2001

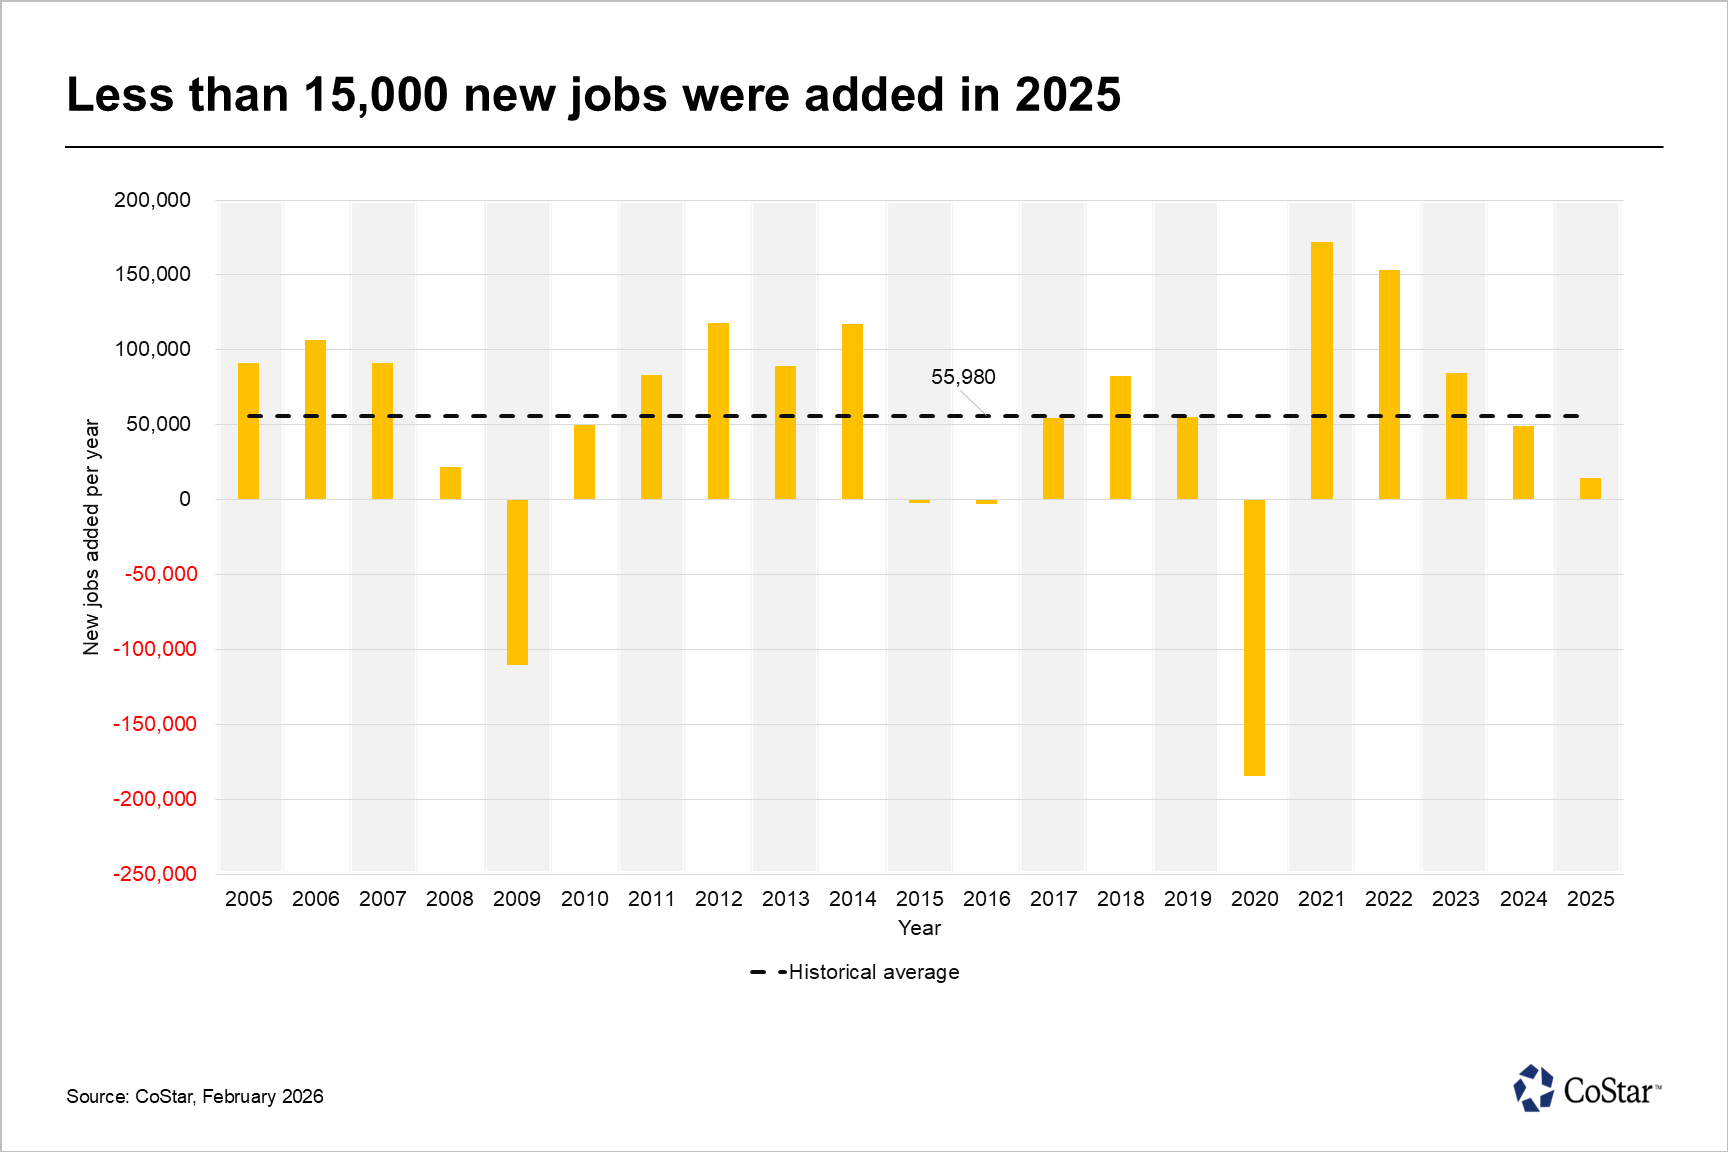
For the second consecutive year, Houston saw job growth fall below the historical average in 2025.
The Bayou City added just 14,800 jobs in 2025, according to preliminary data from the U.S. Bureau of Labor Statistics. For comparison, the metropolitan area has averaged about 56,000 new jobs per year over the past two decades. When excluding extreme boom‑and‑bust periods, such as the 2009 financial crisis, the 2020 pandemic and the unusually strong rebound years that followed, Houston’s typical annual job growth is closer to 70,000.
Private education and health services sector led job gains, which added almost 13,000 new payrolls, and was more than double that of the next sector — trade, transportation and utilities. Houston’s rapid population growth continues to drive demand for schools, healthcare and social services, and the ongoing expansion of the Texas Medical Center remains a major contributor.
The trade, transportation and utilities sector, which makes up a notable portion of Houston’s industrial employment market, added 6,300 new payrolls.
By contrast, the professional and business services sector accounted for most of the losses, shedding 18,500 jobs, levels similar to 2020 and among the steepest declines on record. The slowdown reflects restructuring across energy and energy‑related industries, which has reduced demand for engineering, consulting, legal and corporate support roles. Many firms are consolidating operations and automating administrative tasks. Elevated interest rates and broader economic uncertainty have also weakened demand for services such as management consulting and corporate expansion support.

Charlie Billello: In the first 4 months of the 2026 Fiscal Year the Federal Government took in $1.8 trillion and spent $2.5 trillion.

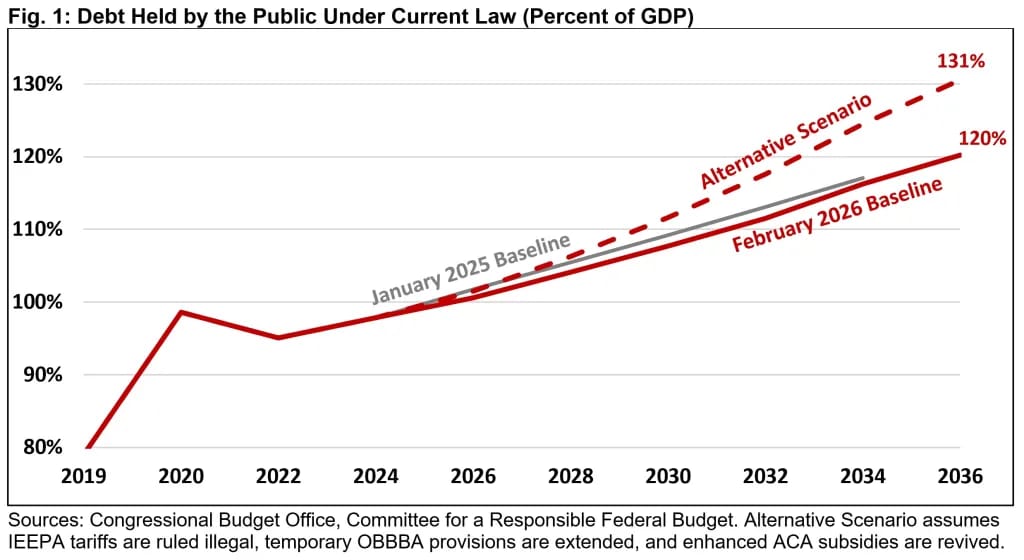
CRFB: Debt will reach a record 120% of Gross Domestic Product (GDP) by 2036.
CBO projects that debt held by the public will grow by $25 trillion, from nearly $31 trillion today to $56 trillion by 2036. As a share of the economy, debt will grow from 100% of GDP today to a record 108% by 2030 and 120% by 2036.
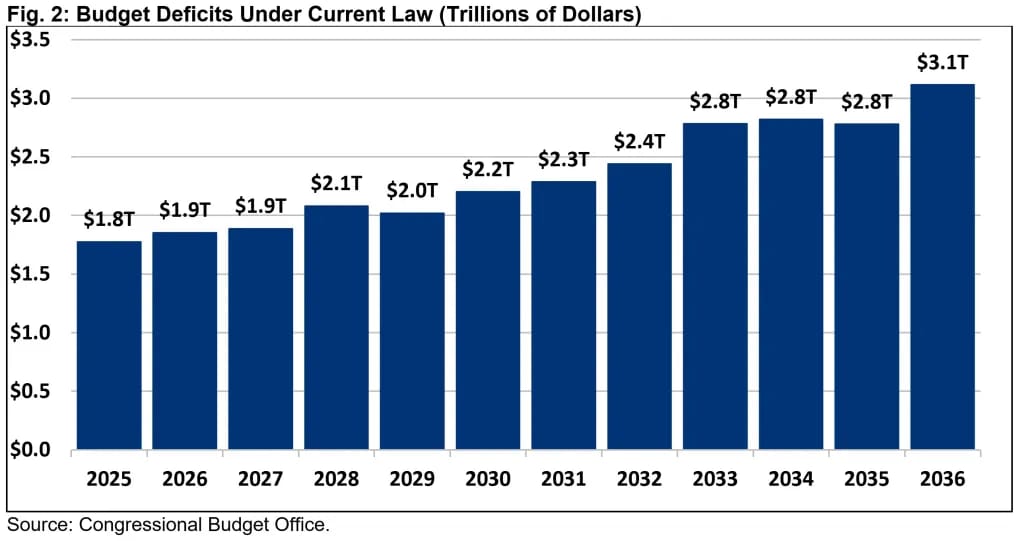
Deficits will exceed $3 trillion by 2036. Deficits will total $24.4 trillion (6.1% of GDP) over the next decade, rising from $1.8 trillion (5.8% of GDP) in 2025 to $3.1 trillion (6.7% of GDP) by 2036.
Spending is larger and growing faster than revenue. Spending will rise from 23.1% of GDP ($7.0 trillion) in 2025 to 24.4% ($11.4 trillion) by 2036. Revenue will rise from 17.2% of GDP ($5.2 trillion) to 17.8% ($8.3 trillion) in 2036.
Interest costs will explode. Nominal interest costs will more than double from $970 billion in 2025 to $2.1 trillion by 2036. As a share of the economy, interest costs will rise from a record 3.2% of GDP in 2025 to 4.6% by 2036.
Major trust funds are approaching insolvency. The Highway Trust Fund will deplete its reserves by 2028, the Social Security retirement trust fund in 2032, and the Medicare Hospital Insurance trust fund around 2040.
Deficit projections are higher than last year. CBO now projects $1.4 trillion more borrowing between 2026 and 2035 than it did last January, with $2 trillion of additional net borrowing from policy changes. The reconciliation law alone will add $4.7 trillion to the debt, while tariffs will subtract $3 trillion.
The economy will surge then normalize, while interest rates will rise. CBO projects real GDP will grow by 2.2% in 2026, due in part to economic stimulus from OBBBA, but slow to 1.8% per year thereafter. They project PCE inflation of 2.7% in 2026, returning to its 2.0% target by 2030. CBO projects short-term interest rates will decline but remain above 3%, while ten-year Treasury yields will grow from 4.1% in 2026 to 4.4% in 2031 and beyond.

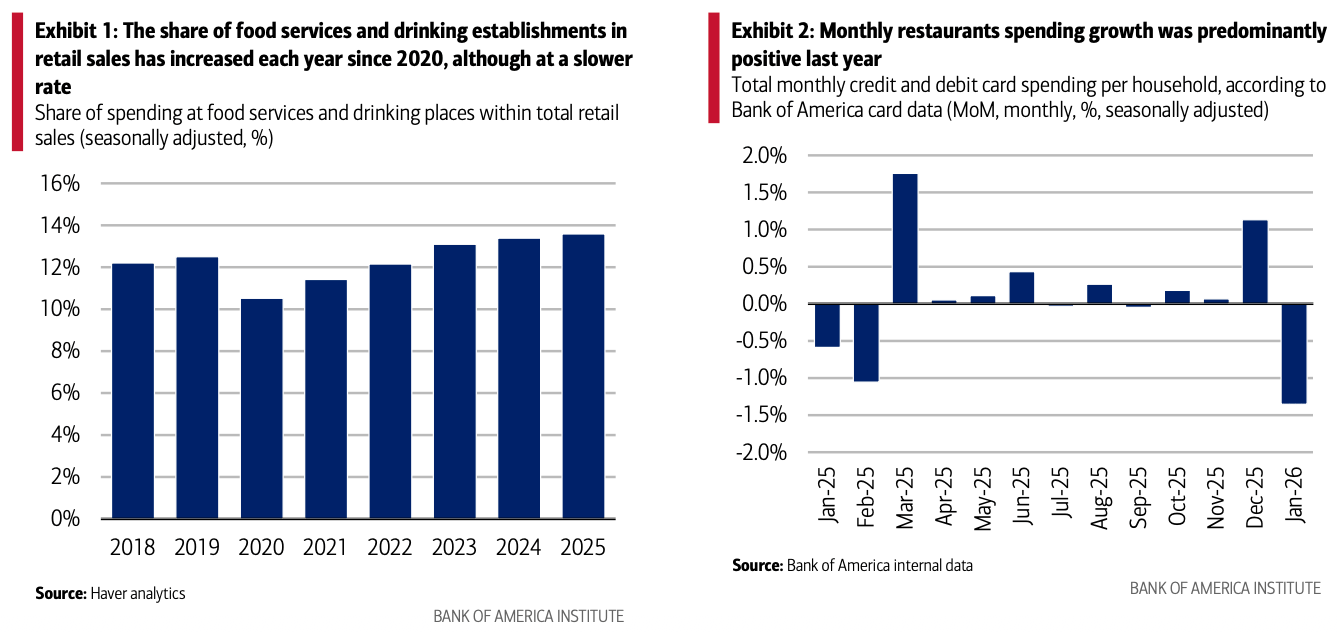
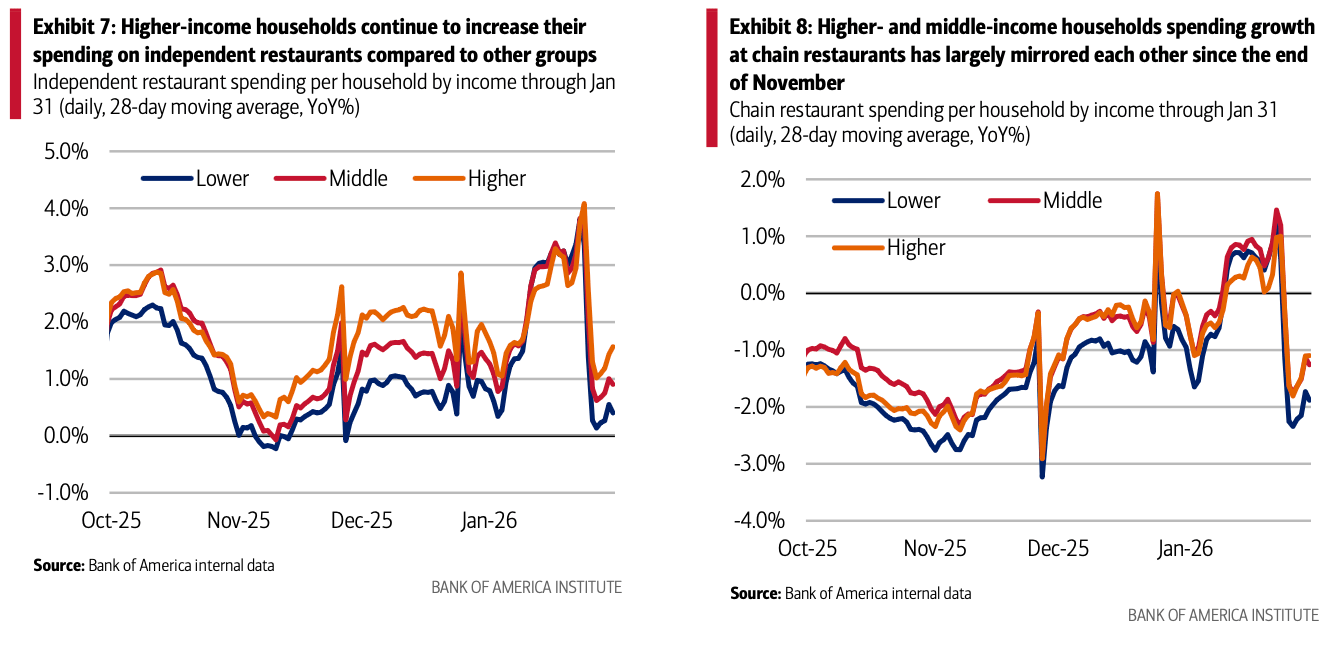
In January, such spending per household was up 3.3% year-over-year (YoY), more than the 2.6% YoY overall spending increase -BofA internal CC & debt card data
Average monthly spending per household on restaurants and bars in 2025 was $371 – this is up 30% from 2019. And though people are eating out more than they did in 2019, some of this strength is due to price increases.
BLS: food away from home was up 4.1% YoY in December 2025.
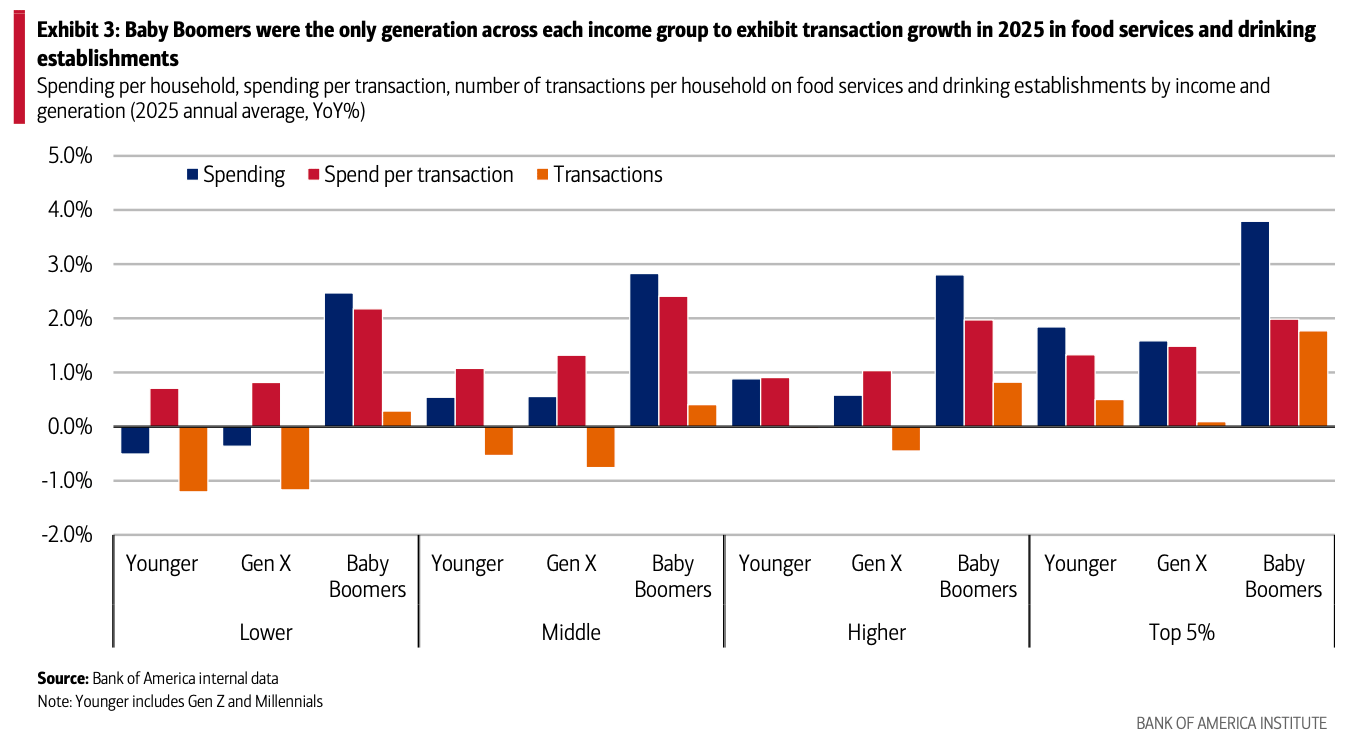
While the amount spent per transaction has increased YoY, the number of transactions per household has only grown at half therate. This underscores the narrative that consumers are being more selective when eating out
While spending per transaction growth is up across all generations and income levels, Baby Boomers consistently outpaced all generations. Additionally, this cohort exhibited the strongest average spending growth and number of transactions, especially among those with the top 5% of household income. Still, in actual dollar terms, younger generations spend more overall than their older counterparts. Notably, Gen Z and Millennials at the upper end of the income spectrum are eating out more frequently than Gen Xers.
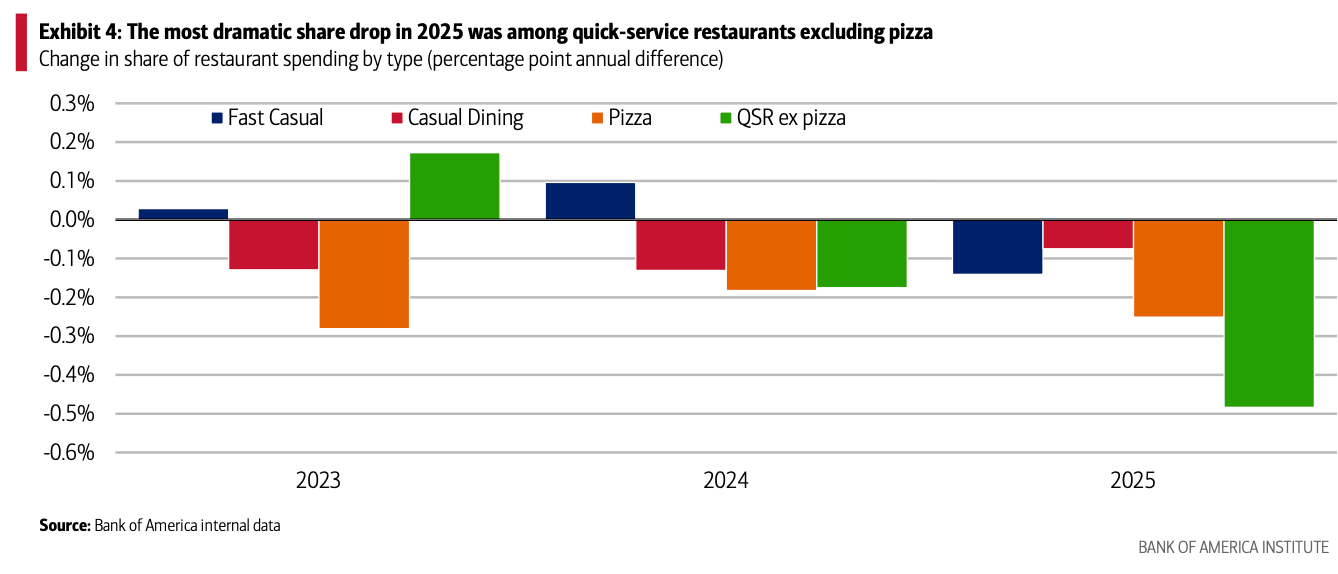
Spending at casual dining spots – think full-service restaurants with a laidback setting – has declined for three consecutive years as has the share of spending at pizza places. The most dramatic drop in 2025 was among quick-service restaurants (i.e. order at the counter or at the drive-through) (QSRs) excluding pizza places. Pizza’s multi‑year share loss likely reflects both category saturation and shifting meal‑time behavior. The rise of QSR options that don’t sell pizza – particularly those with customizable bowls, handheld items, and perceived “healthier” choices – has created more competition in an arena where pizza has dominated weeknight convenience dining.
San Diego entered 2026 with nearly 9,500 market-rate units under construction after builders broke ground on 4,000 units last year. While that was slightly fewer than the 10-year average in starts, there were nearly 1,000 more units in the construction pipeline than the decade average.
After 4,900 market-rate units were completed in 2024, a 20-year-high 6,200 were completed in 2025. Another 4,800 are scheduled to be completed this year.
Those nearly 16,000 market-rate units would be the most to open in a three-year stretch in 25 years

About 234,900 residents moved into Arizona from other states and Washington, D.C., in 2024, while about 179,800 moved out. The resulting net change of about 55,100 people ranks Arizona as the nation’s fourth-largest recipient of net state-to-state inflows, trailing only Texas, Florida and North Carolina.
Demographics have long been a strength of the state. Relative affordability, greater job opportunity and the nonwinter climate form an appealing draw attracting residents. Maricopa County, the principal county of Phoenix and the fourth-largest in the nation, regularly ranks among the fastest-growing counties in the United States.
