- Location Strategy Chartbook
- Posts
- Location Strategy Chartbook 030224


Happy Texas Indepedence Day! On March 2, 1836, 59 delegates gathered at Washington-on-the Brazos to officially declare indepedence from Mexico. Four days later, on March 6 - the Alamo would fall to Mexican troops under Santa Anna.
Location Strategy Chartbook
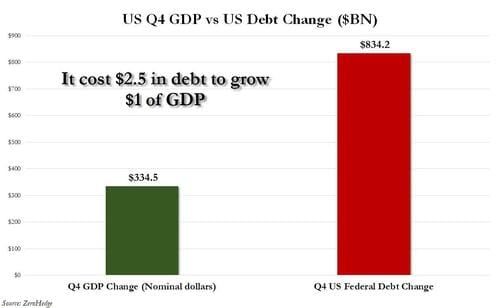
Here is one of the problems with high Federal debt levels: the economy grew by $334 billion on Q3, but it required issuance of $834 billion in debt. That is: every $1 of growth required $2.50 in debt. And it will only get worse as our debt to GDP ratio grows.
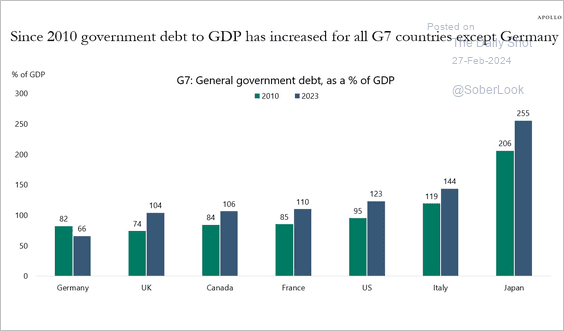
Changes in government debt-to-GDP ratios:
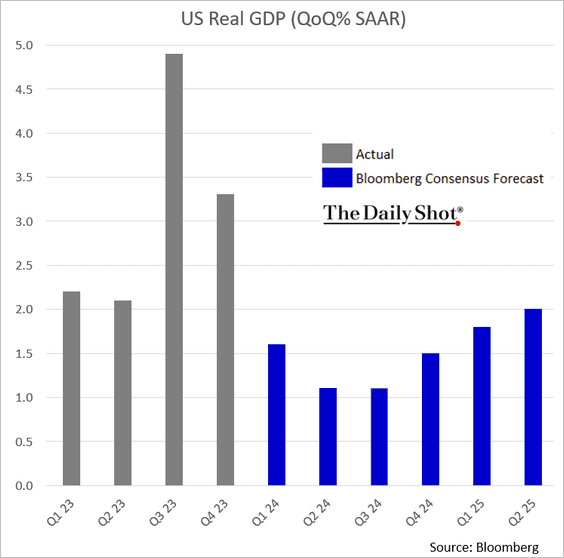
Consensus projections show slower growth over the next couple of quarters, with momentum picking up in Q4.
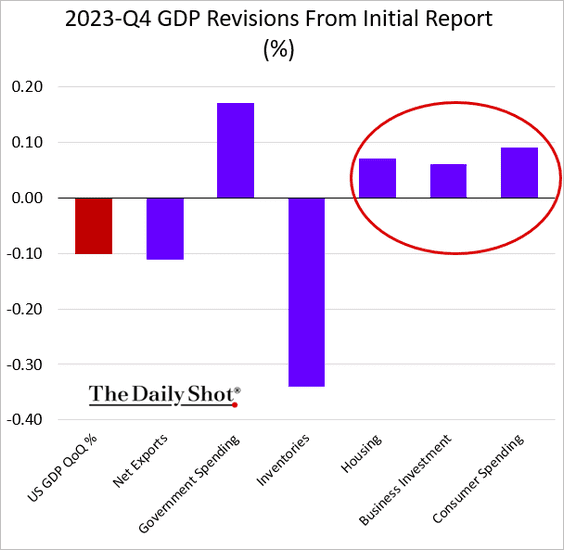
GDP revisions.
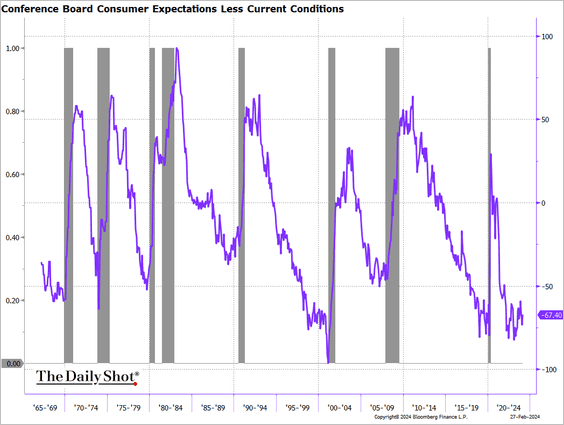
The spread between expectations and current conditions remains at recessionary levels.
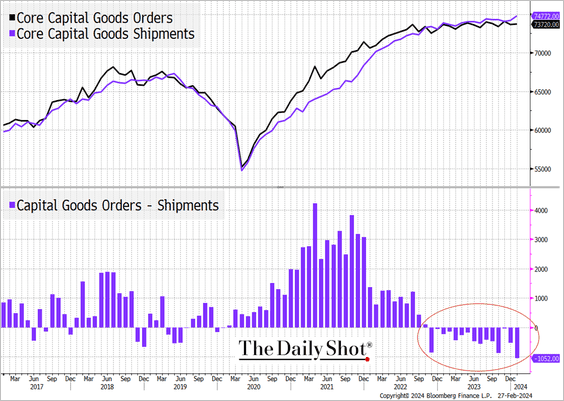
Capital goods orders are now lagging shipments, signaling weaker demand.
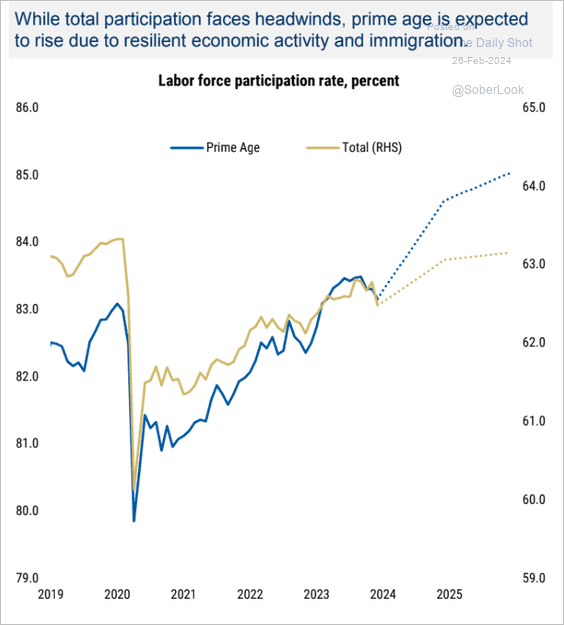
Morgan Stanley anticipates strong gains in prime-age labor force participation this year.
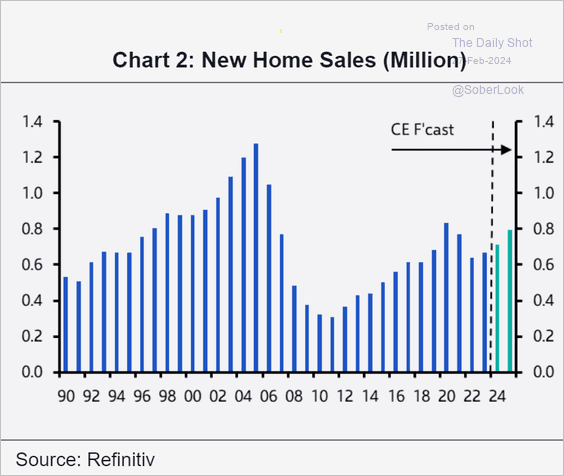
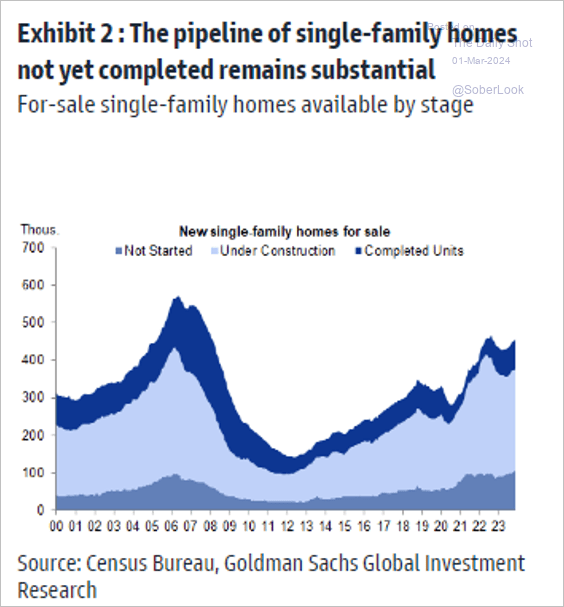
Capital Economics expects new home sales to grow over the next couple of years.
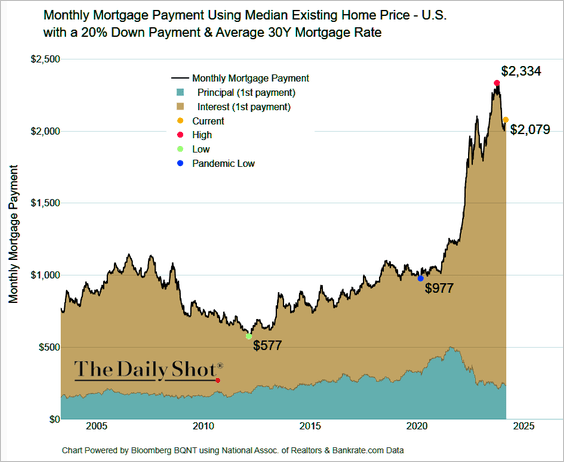
The median mortgage payment for new homebuyers has decreased from the record highs of last year but still remains elevated.
Housing inflation may end up being stubbornly high for some time.
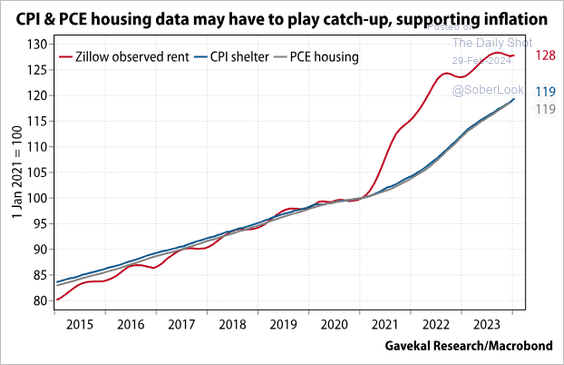
Housing inflation may end up being stubbornly high for some time.
There Are Two Economies But Only One Interest Rate
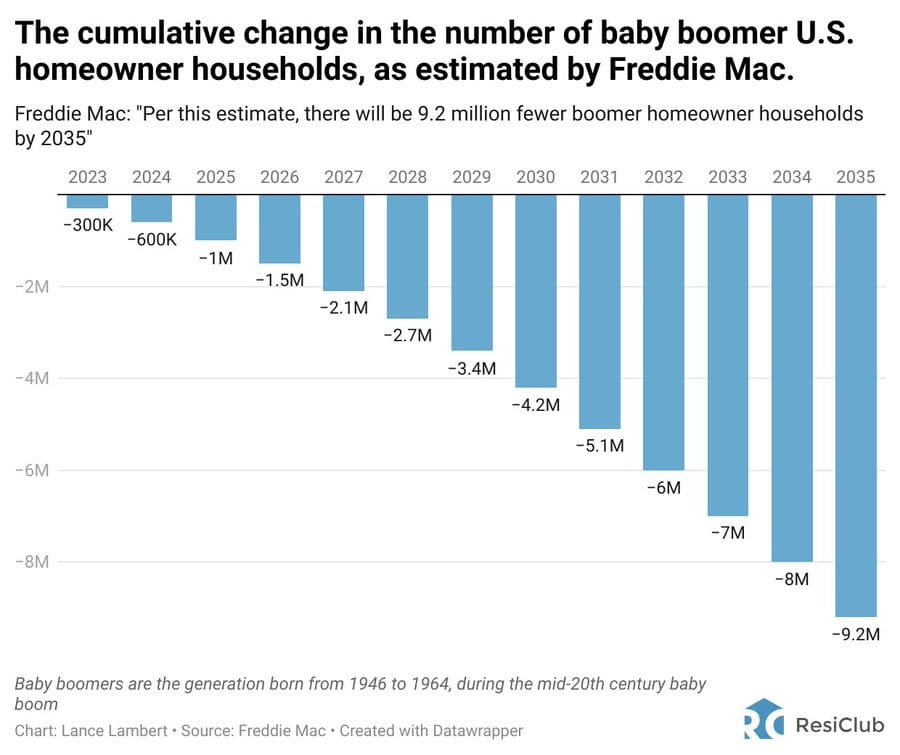
Boomers’ exit from the housing markets will increase supply, but that’s not likely to happen any time soon.
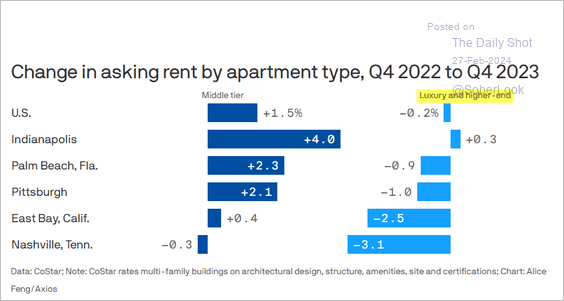
The influx of new apartment units has predominantly affected the higher-end/luxury rental market. Meanwhile, rents for mid-tier apartments continue to rise in a number of cities.
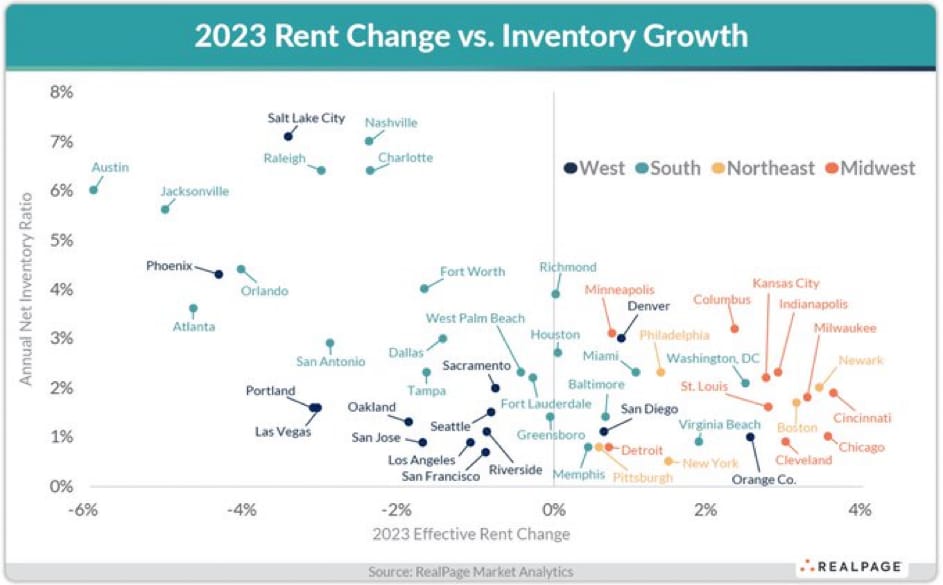
Go figure. Areas that are building more housing are experience lower rent increases or outright declines.
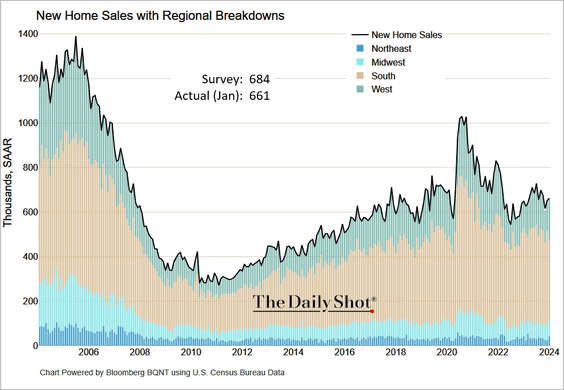
New home sales modestly exceeded last year’s figures but fell short of projections.
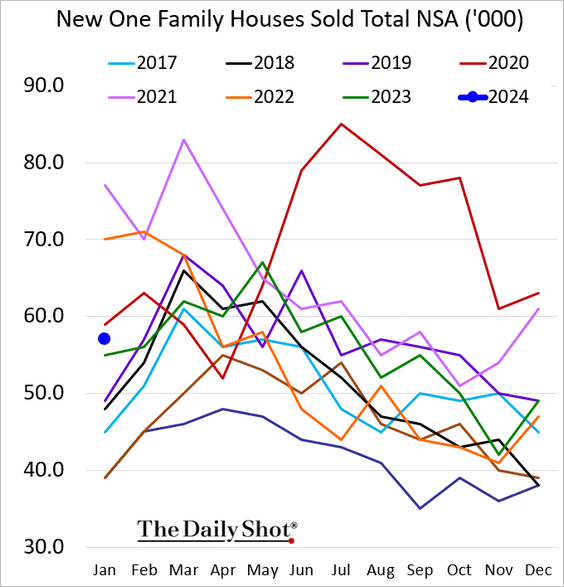
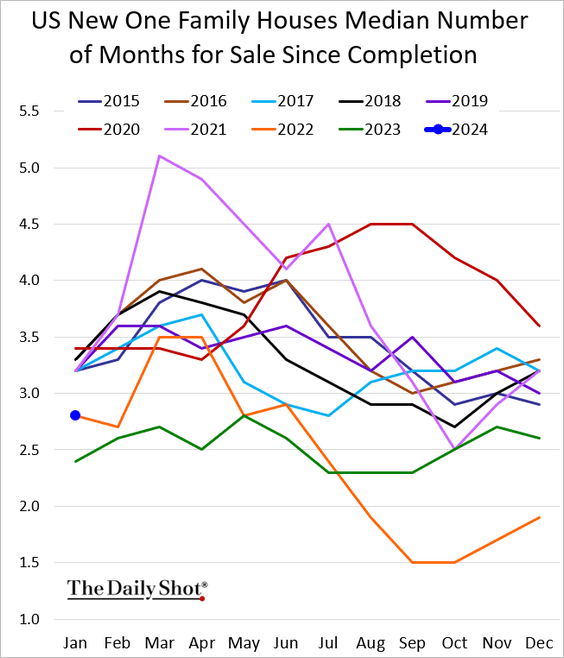
Inventories were roughly in line with 2022 levels.
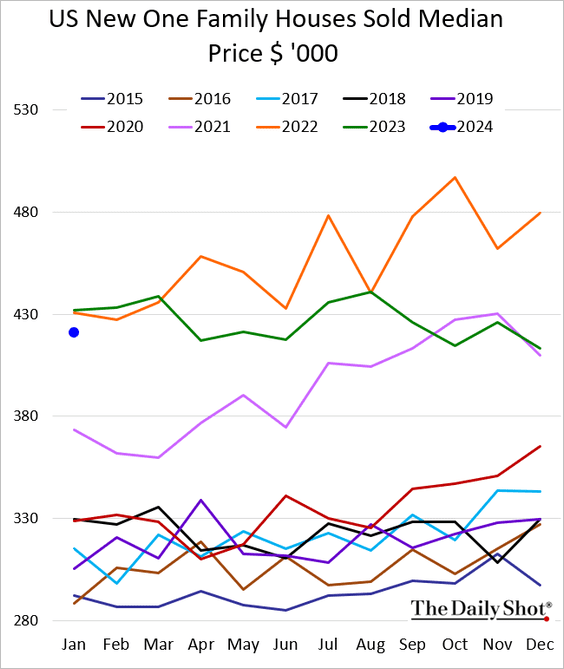
The median new home price was below last year’s level.
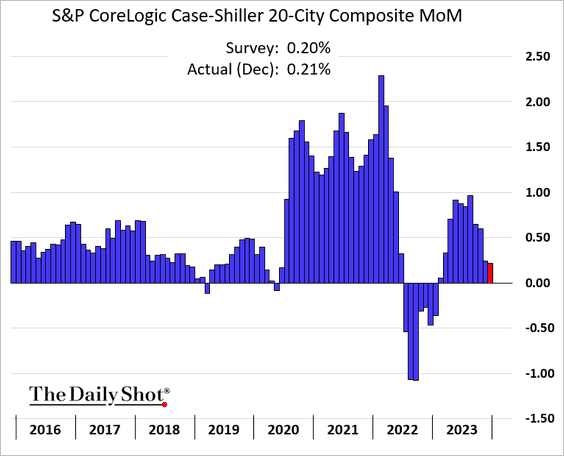
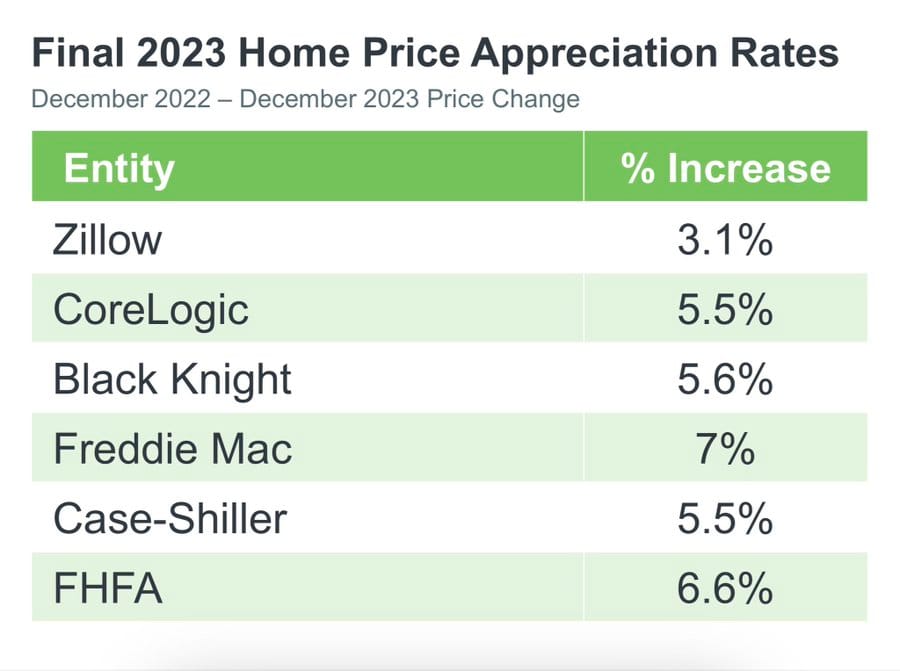
Home prices climbed again in December.
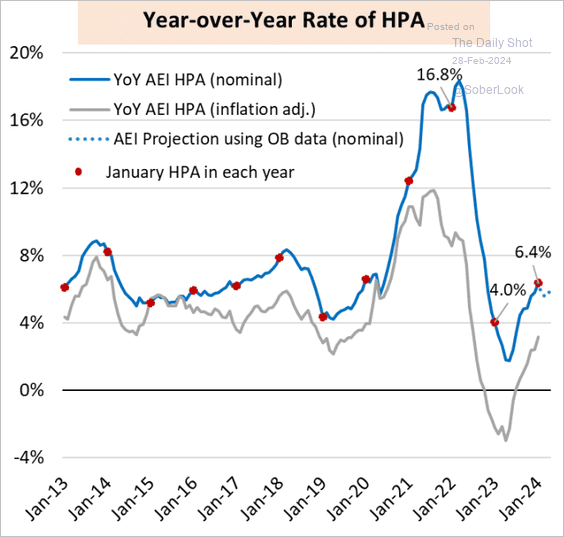
For more current data, as Case-Shiller figures lag by two months, here is the home price index from Optimal Blue (via the AEI Housing Center), showing home price appreciation through January.
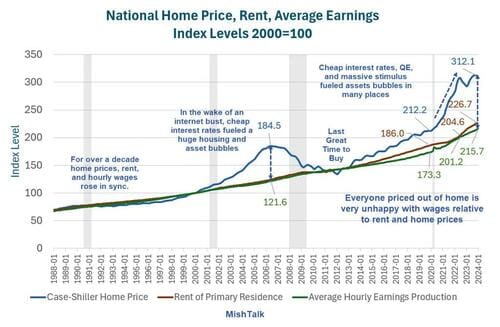
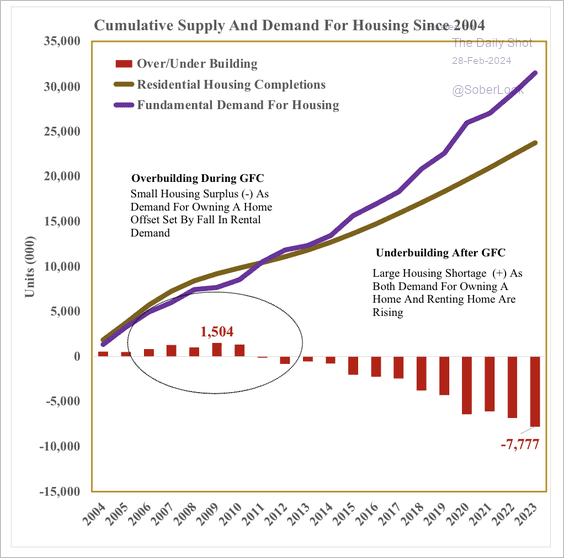
Supply shortfalls have contributed to rising house prices.
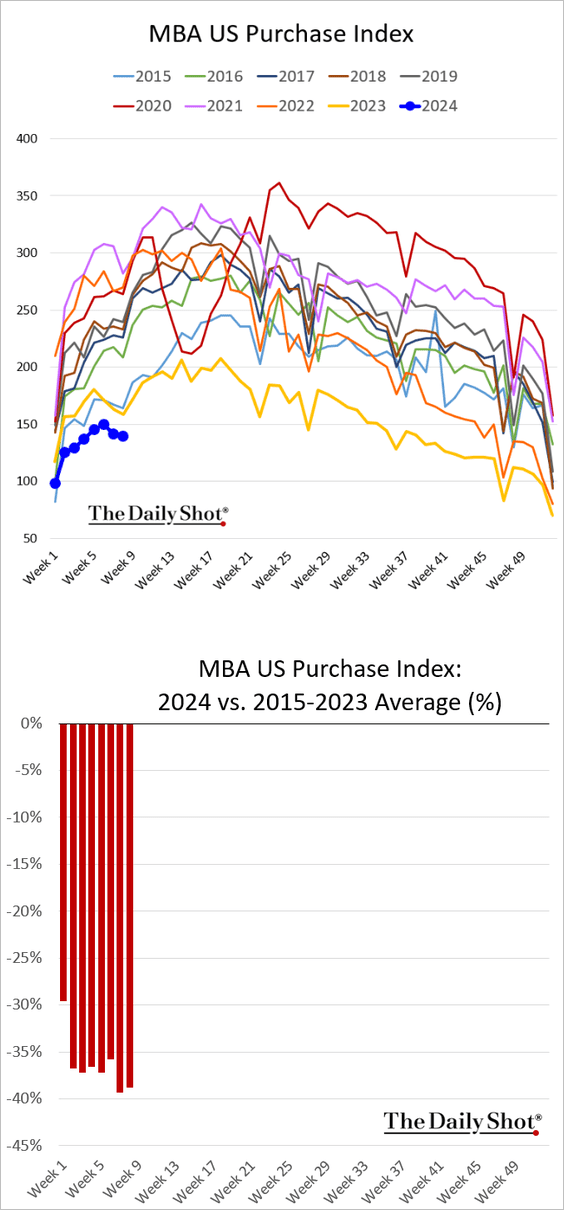
Mortage applications are holding at multi-year lows,
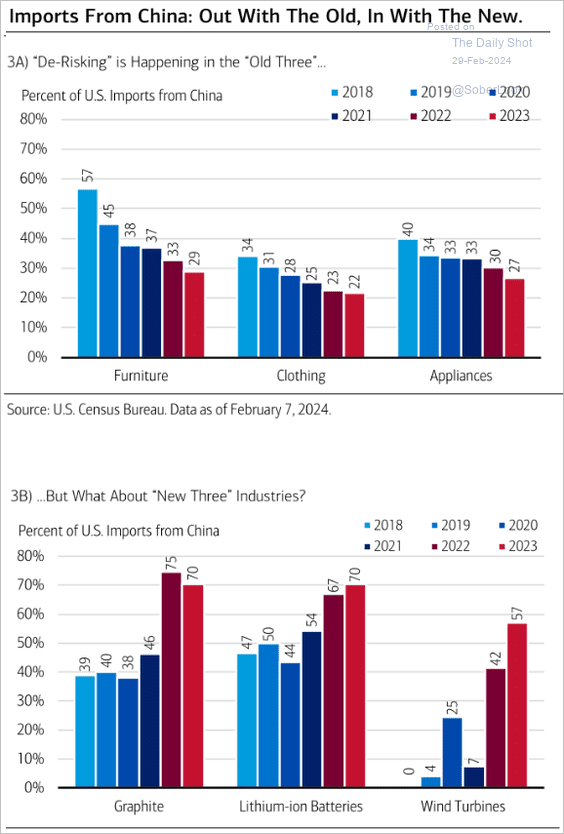
China trade is down except in green energy materials.
X