- Location Strategy Chartbook
- Posts
- Location Strategy Chartbook 04.04.2026
Location Strategy Chartbook 04.04.2026
Real Estate Market Insights
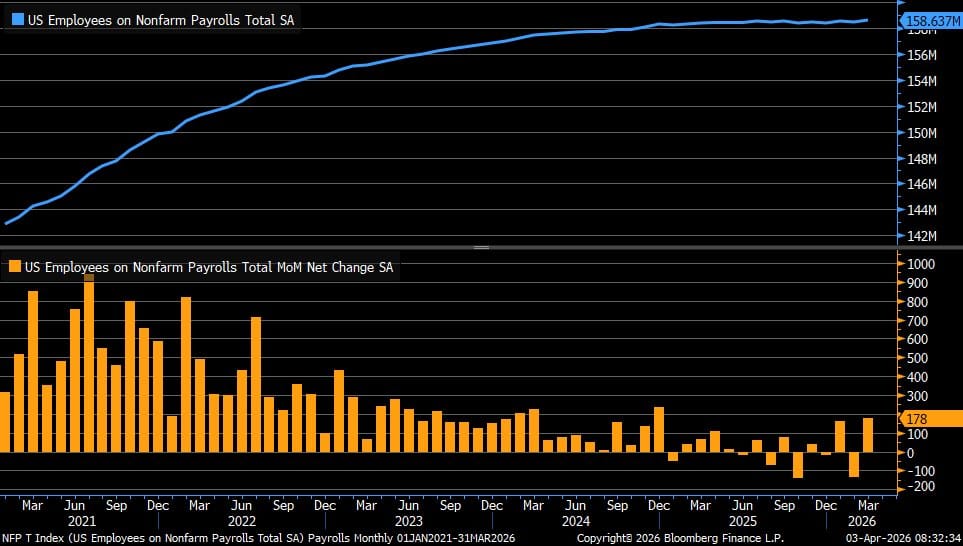
Liz Ann Sonders, Schwab: March nonfarm payrolls +178k vs. +65k est. & -133k in prior month (rev. down from -92k)…best month since December 2024
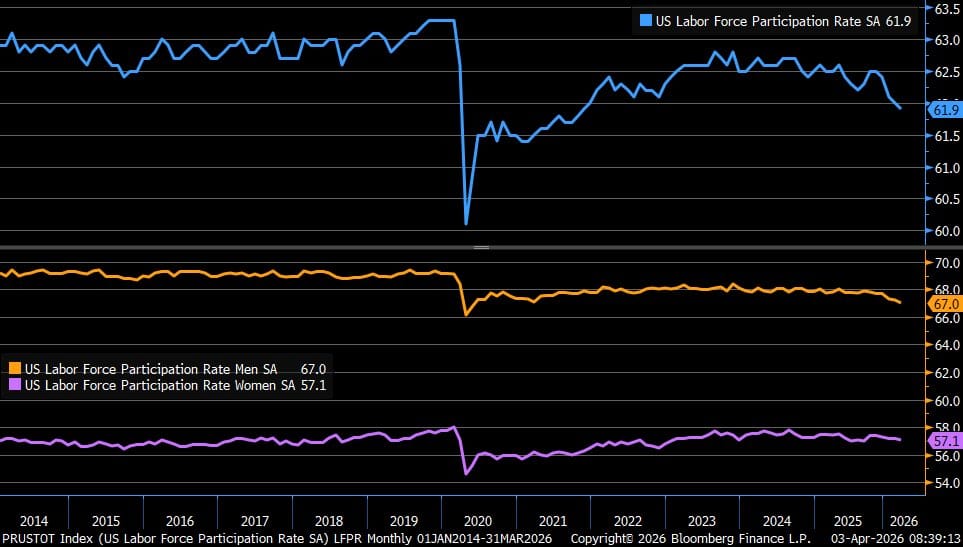
March labor force participation rate lower at 61.9% (blue line); rate for men lower at 67.0% (orange line); rate for women lower at 57.1% (purple line)
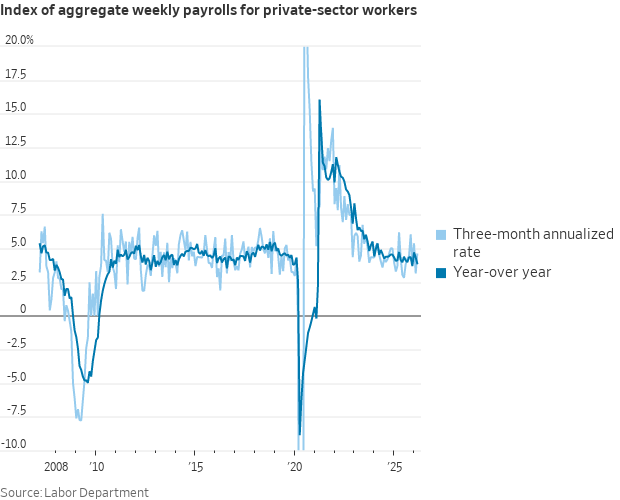
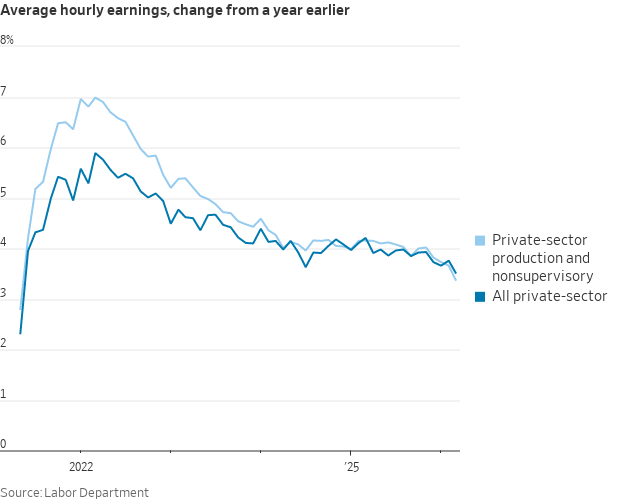
WSJ: INCOMES: A drop in the average workweek in March led to very little growth in the index of aggregate weekly payrolls for private-sector workers (which combines hiring, wages, and hours). The 12-month change ticked down to 3.9%
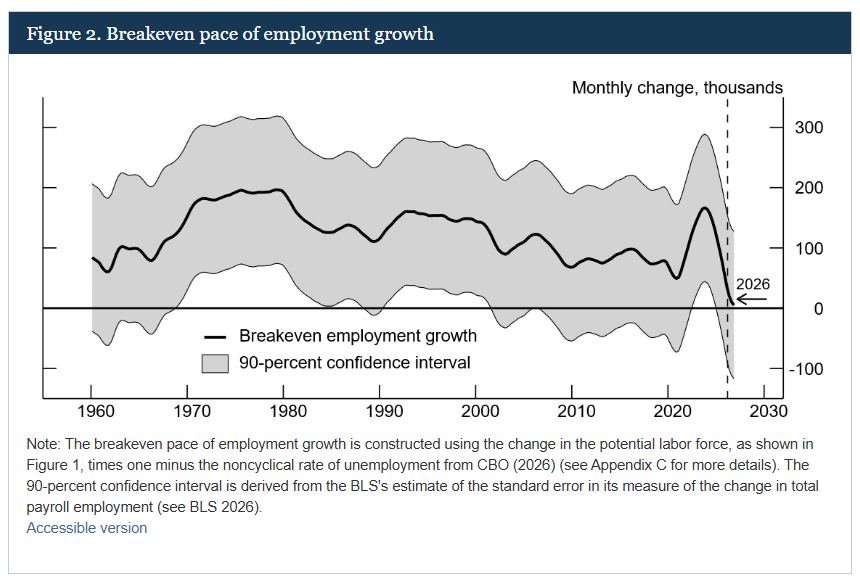
Nick Timiraos, WSJ: A new paper from Fed board economists concludes that "breakeven" job growth is near zero, which means negative job growth would be almost as likely as positive job growth in any given month even if the economy is at equilibrium.
The so-what-statement:
"It would not be unusual for there to be one or more months in 2026 with declines in total payroll employment as large as -100,000 jobs, even if economic output was growing at the rate of potential output growth."
The paper suggests labor force growth is running at less than 10,000 per month: "Such a slowdown in potential labor force growth is unprecedented in recent history and would have significant implications for the U.S. economy."
After another week of fighting and confused messaging from the White House, oil markets became more decisive: The most important price for real-world oil barrels surged above $140.
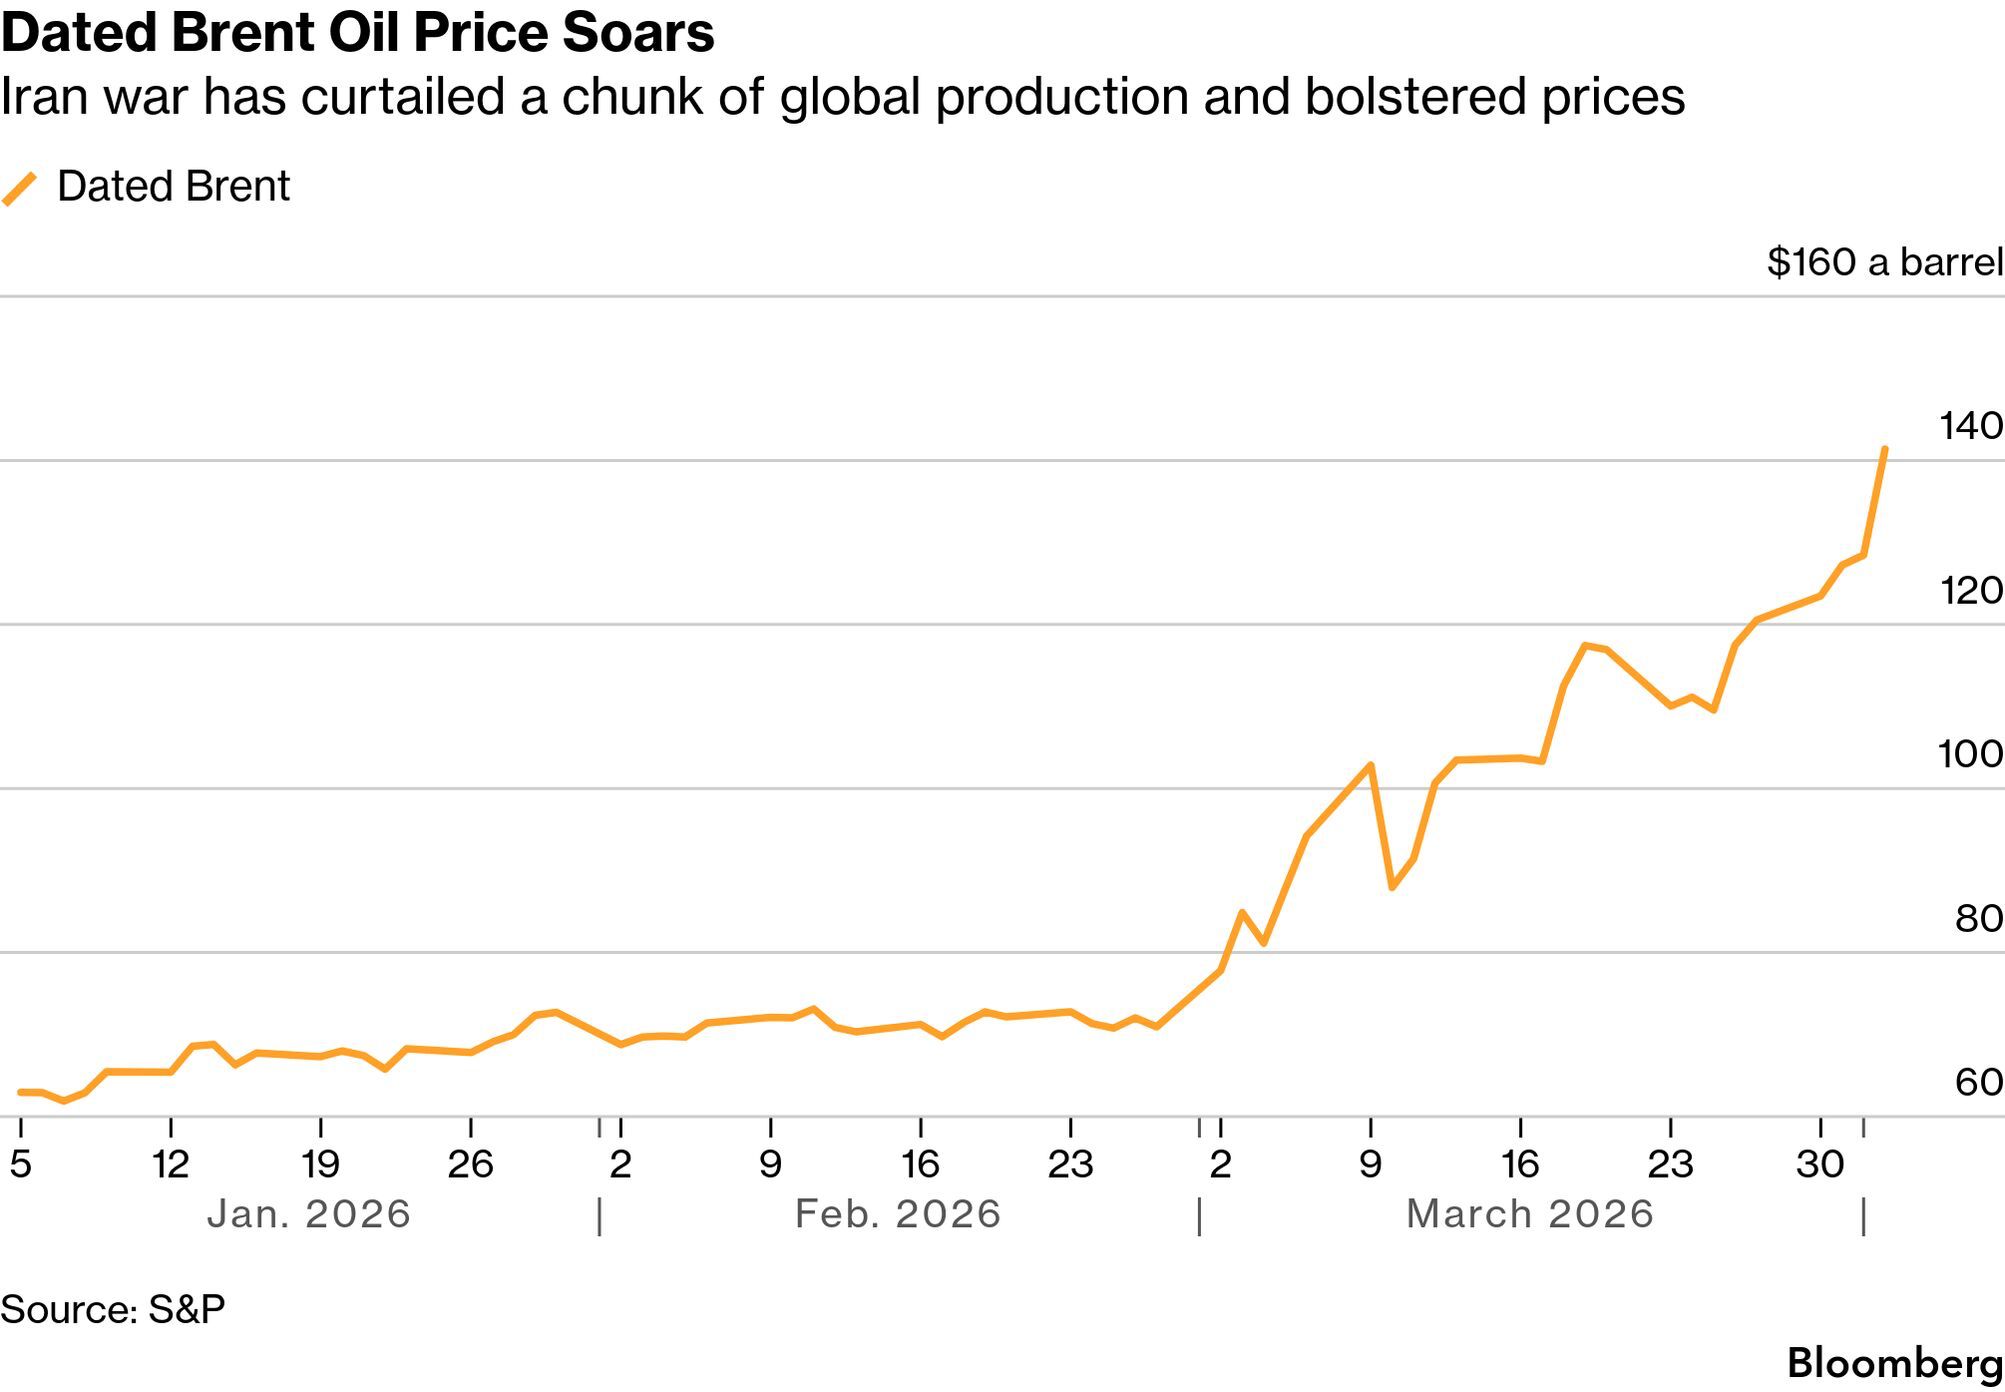
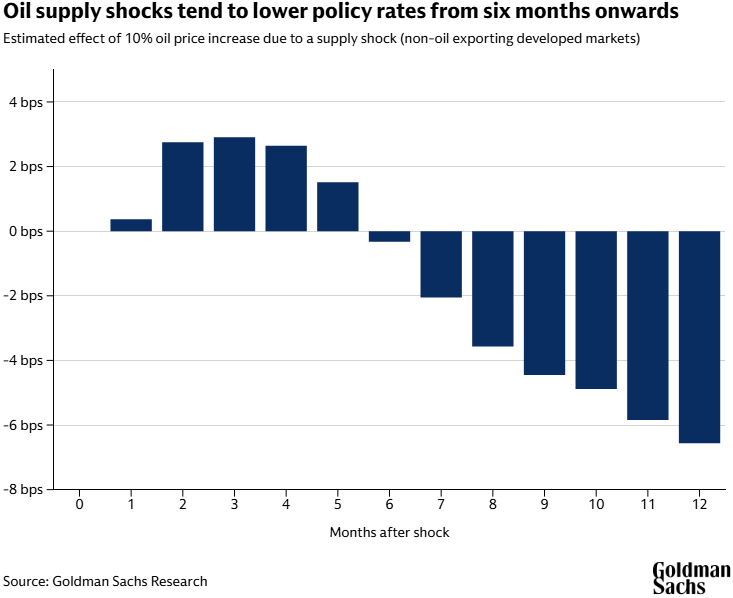
Interest rates in developed markets have jumped amid fears of rising inflation since the start of the war in Iran. But while markets may be right to expect tighter monetary policy initially, history suggests that supply-driven oil price shocks lower policy rates beyond the short term.
The impact of a shock to oil supply on rates has historically been ambiguous, according to Dominic Wilson, a senior advisor in the Global Markets Research Group. Rising oil prices drive up inflation, but they also tend to weigh on economic growth, which complicates the job of central banks.
“The average historical experience shows slightly higher policy rates in the first one-to-three months after an oil supply shock and lower policy rates six-to-nine months out as growth worries weigh more heavily,” Wilson says.
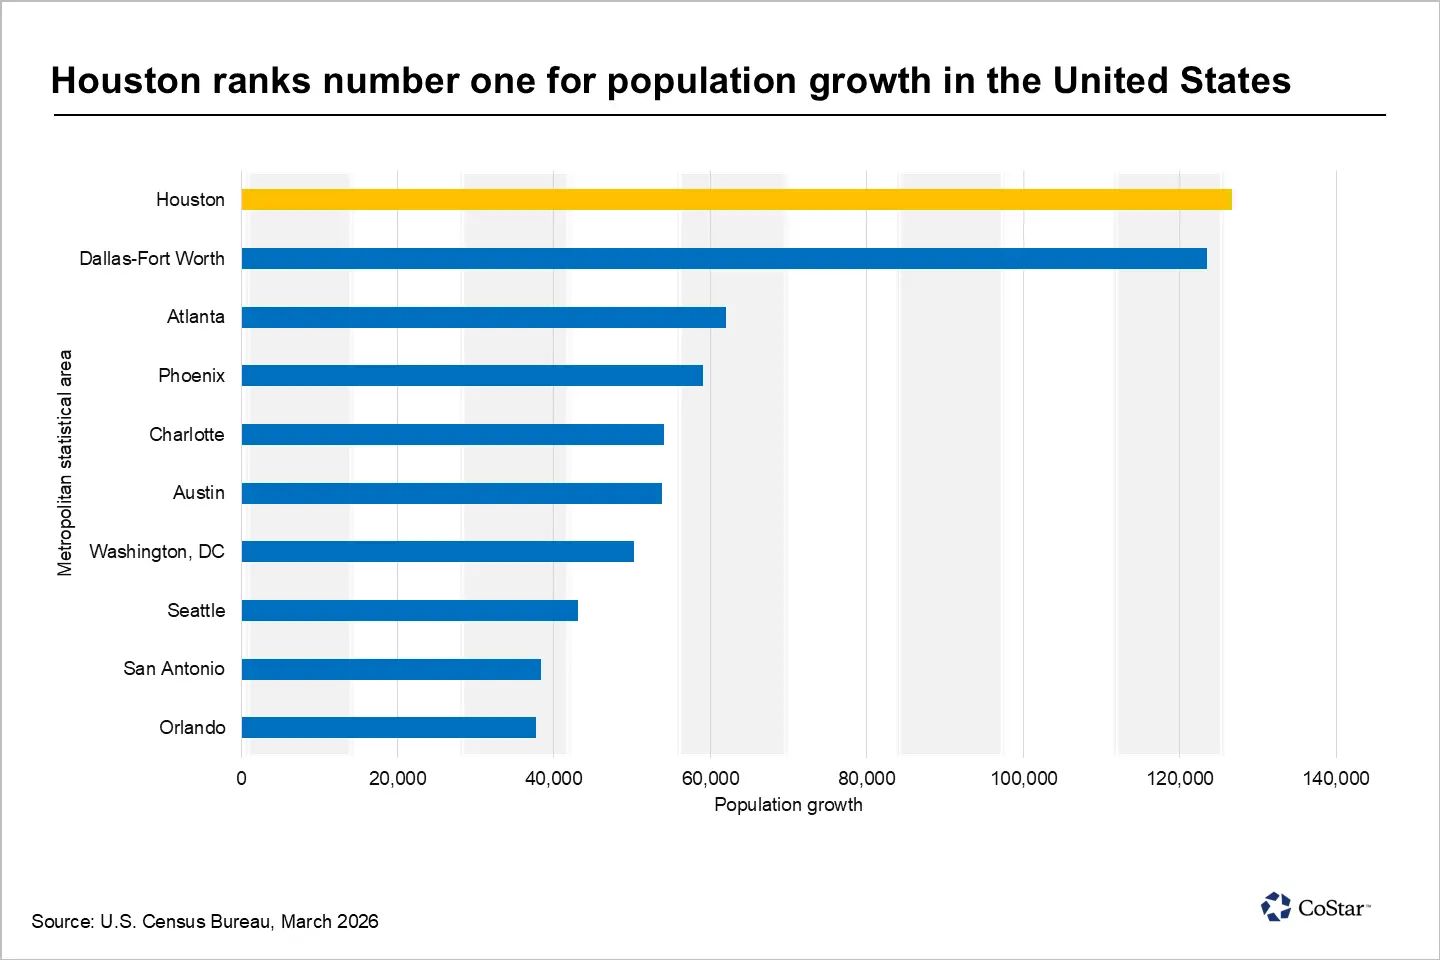
Houston grew its metropolitan population by 126,720 people on a net basis between 2024 and 2025, according to recently released estimates from the U.S. Census Bureau.
This is the largest absolute increase in the nation, slightly more than the Dallas-Fort Worth area's 123,557-person gain, which was number two.
Still, the most recent population gain represents a 1.6% year‑over‑year increase, down from 2.5% between 2023 and 2024. By comparison, the U.S. population grew 0.5% over the same period.
Houston added 63,541 fewer residents in 2025 than in 2024, reflecting a sharp slowdown in population growth.
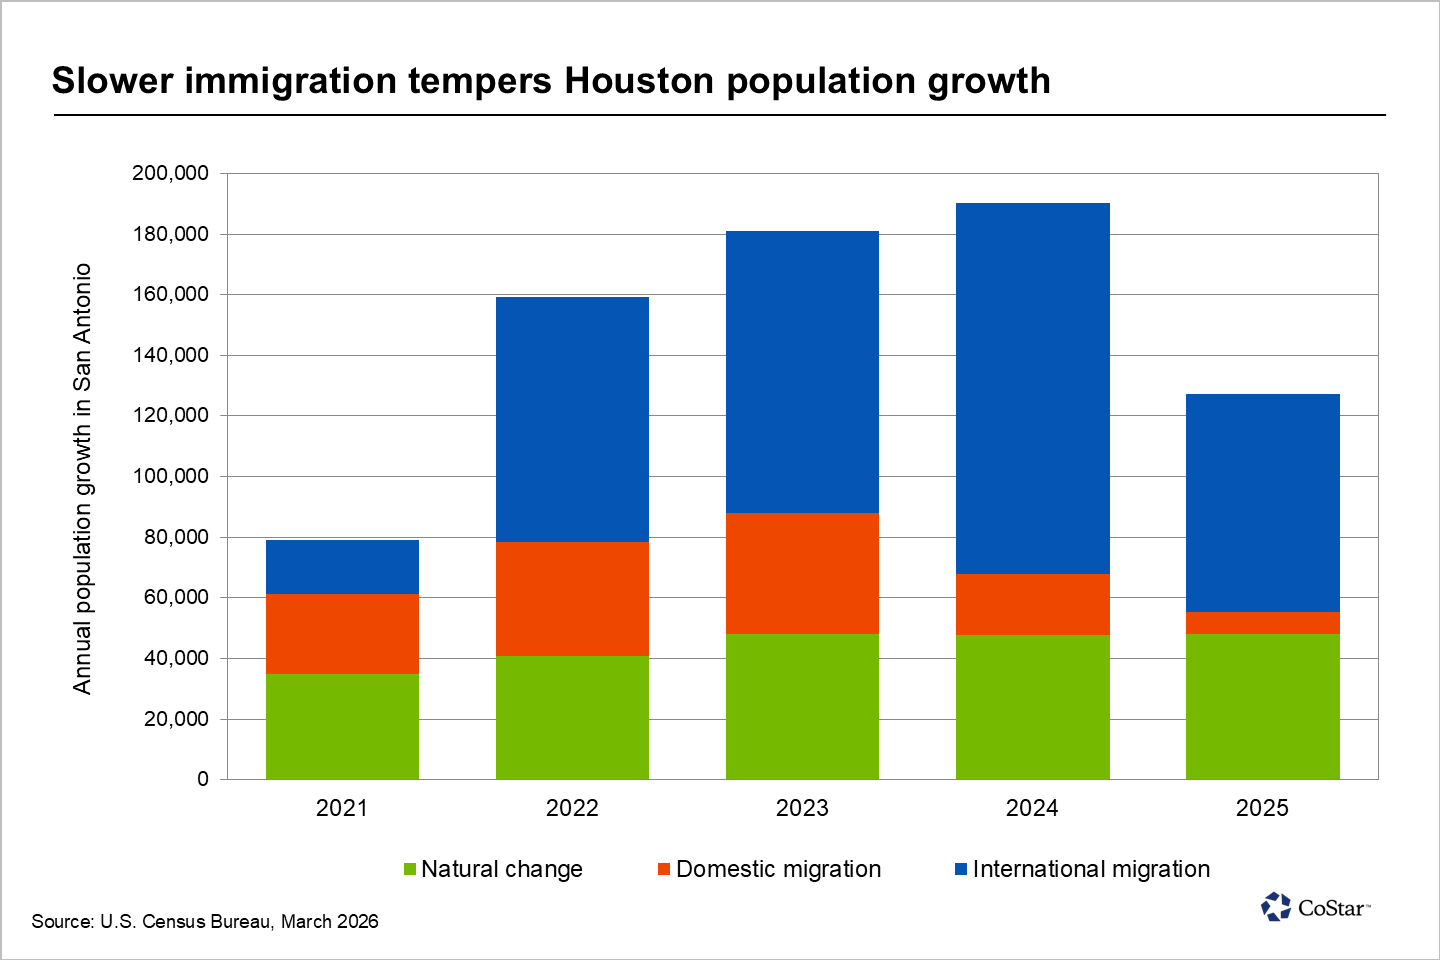
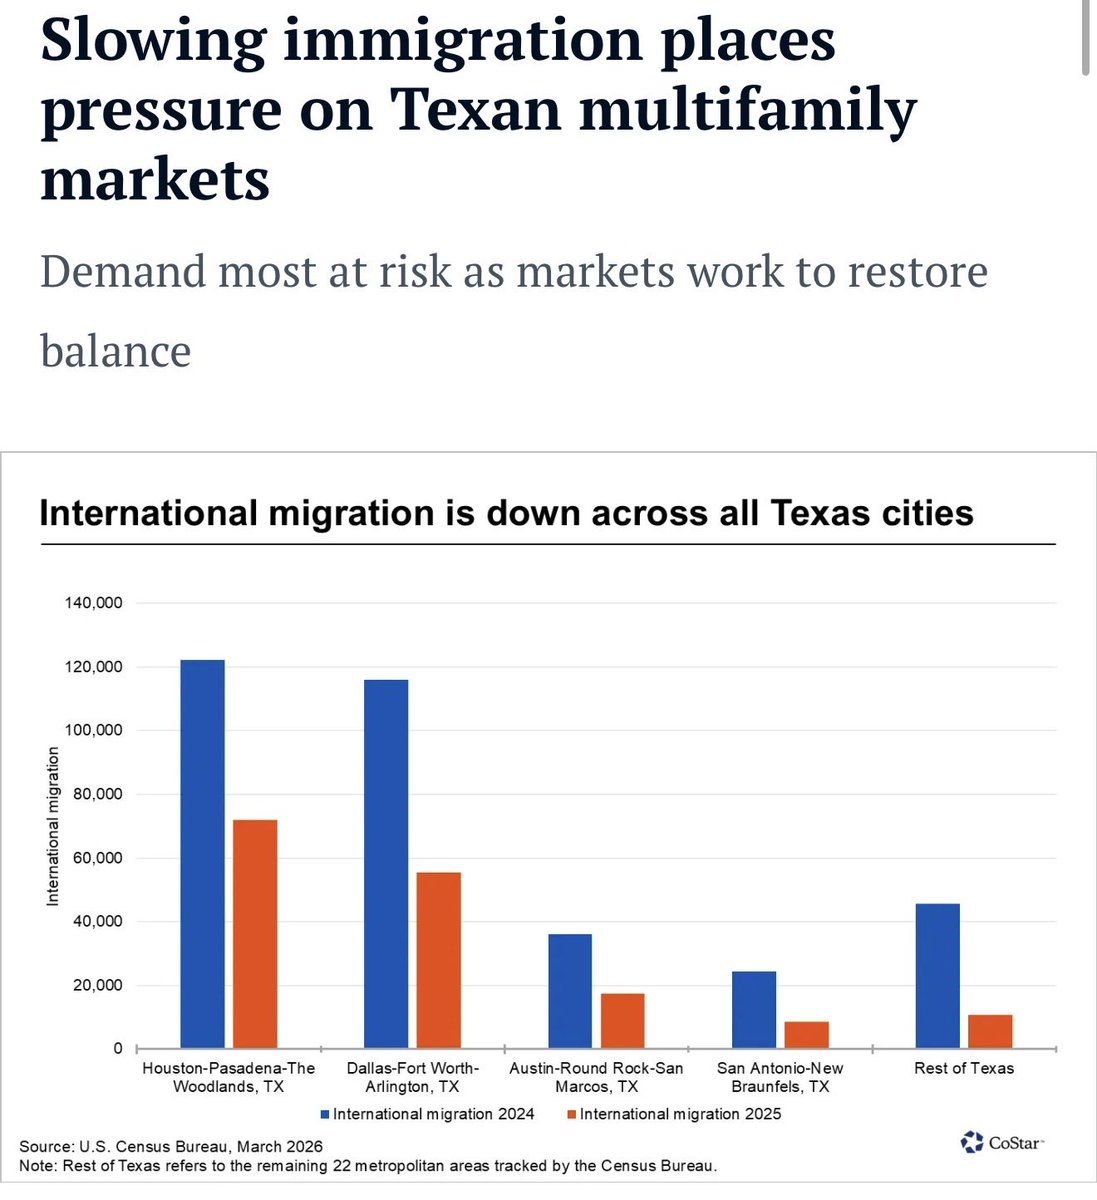
Pace of international in-migration was roughly cut in half across the 4 largest Texas metros
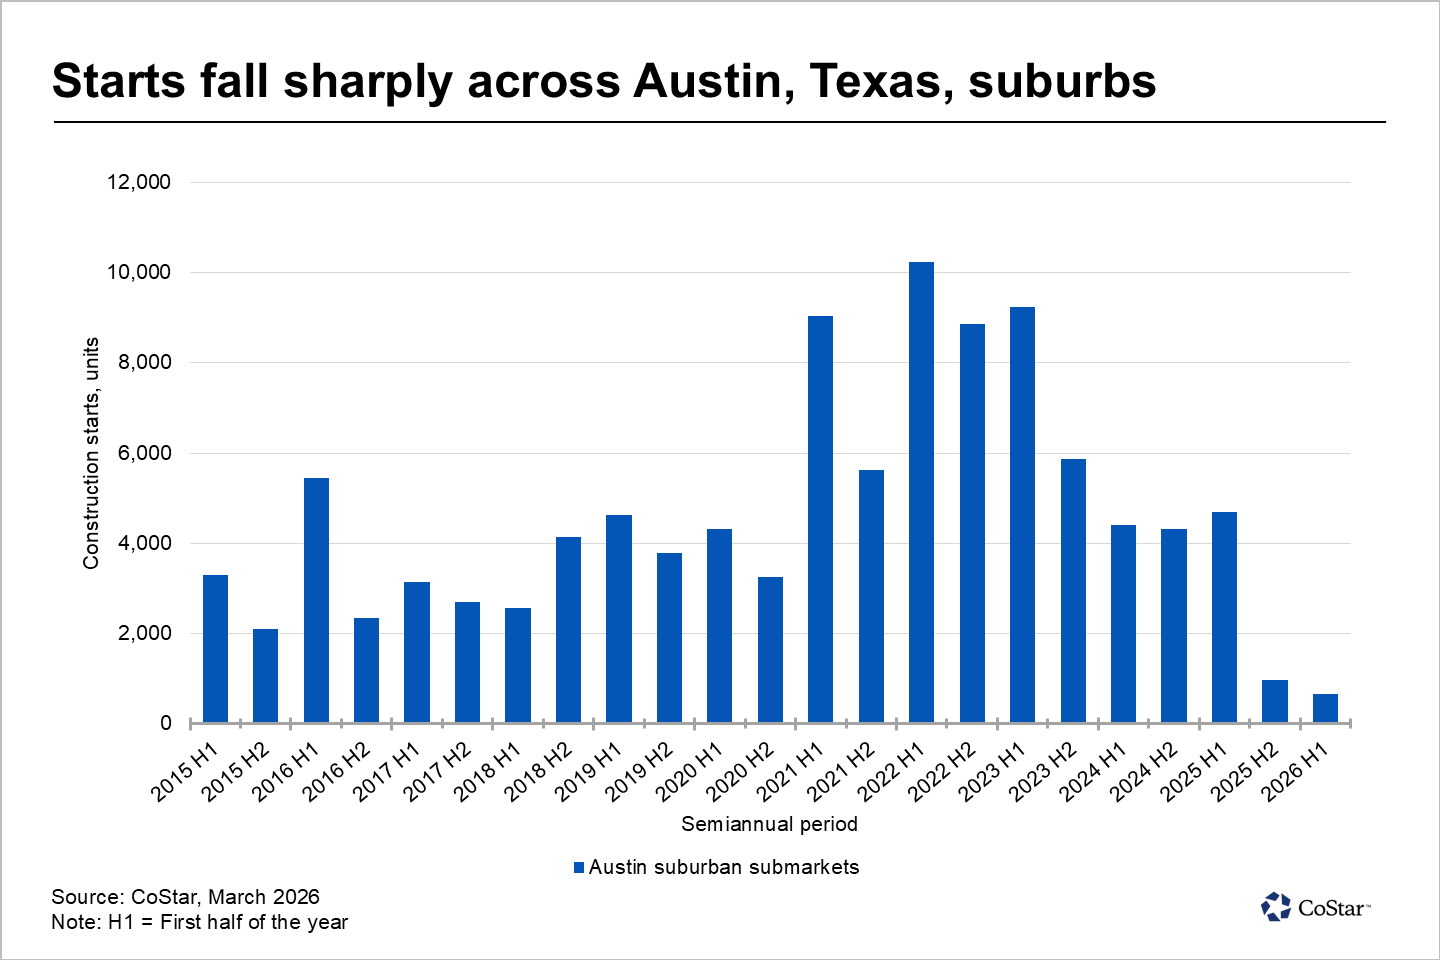
Fewer than 1,000 units broke ground between July 2025 and December 2025, marking the lowest level of suburban construction starts in Austin in 14 years. Suburban construction starts reflect activity across the 15 Austin submarkets outside the urban core, including Northwest Austin, Round Rock, Pflugerville and Georgetown, among others.
Elevated development activity that accelerated in recent years pushed the collective vacancy rate in these areas to 14.5%, above the metropolitan area average of 13.5%, and has translated into weak asking rent growth, currently standing at negative 5.4% year over year.
Vacancy pressures are more acute among recently completed properties that are still in lease-up. Properties completed in 2024 and 2025 across suburban submarkets currently have a vacancy rate of 32%, equivalent to 10,400 vacant units. The pullback in new starts has reduced the suburban construction pipeline to fewer than 8,900 units. That total represents a significant decline from the 15,400 units that were underway one year earlier and remains well below the recent peak of 30,800 units reached in the third quarter of 2023.
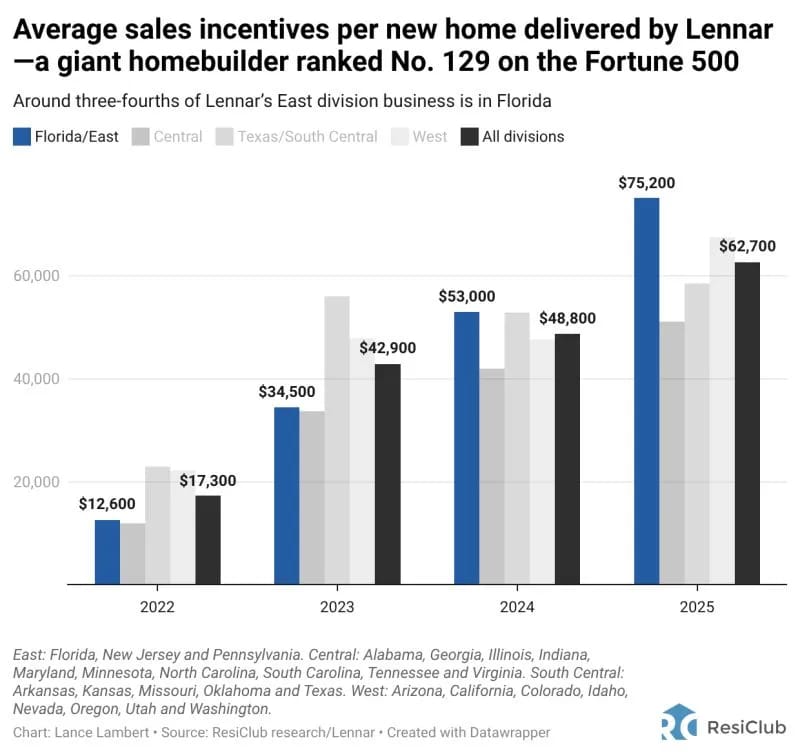
Lennar—America’s second-largest homebuilder—had to spend $62,700 on incentives per average home sale last year. Back in 2022, that figure was $17,300.
Among big builders, Lennar has been the most aggressive on the incentives front.