- Location Strategy Chartbook
- Posts
- Location Strategy Chartbook 04.18.2026
Location Strategy Chartbook 04.18.2026
Real Estate Market Insights
Coming into the year, Goldman Sachs Research expected the transition from a tariff drag in 2025 to a tax-cut boost in 2026 to generate above-potential GDP growth in 2026. But our economists now expect the drag on growth from higher oil prices to roughly offset the boost to growth from the 2025 fiscal bill.
Reflecting both the impact of higher oil prices and incoming GDP tracking data for the first quarter, Goldman Sachs Research has lowered its 2026 GDP growth forecast (fourth quarter over fourth quarter) by 0.5 percentage point to 2% (or 2.3% on a full-year basis) since the war began.

Following the closure of the Strait of Hormuz, oil markets tightened sharply, sending gasoline and diesel prices higher and fueling a 0.9% monthly increase in the consumer price index (CPI) in March. That pushed the annual headline inflation rate to 3.3%, up from 2.4% in February and rising at the fastest pace in two years.
Gasoline prices rose 21.2% in March, lifting the national average for regular gas above $4 per gallon, while fuel oil climbed 30.7%, pushing diesel costs to more than $5.60 per gallon.
Natural gas prices moved in the opposite direction, falling 0.9% after giving back some of the gains tied to February’s colder-than-usual weather. Overall, energy prices rose 10.9% in March, bringing the annual gain to 12.5%.

The costs of transportation services rose 4.1% from a year earlier in March, faster than the prior month’s increase. Higher costs in this sector could boost the prices of food, clothing and other goods in the coming months.

Mortgage Rates Today, April 17, 2026: 30-Year Rates Hit 4-Week Low

An actual 30 year mortgage quote on Friday, April 17, 2026 in San Diego County for a top credit borrower with 20% down on a single family property, at no points

Seattle-area logistics facility vacancy rates have risen to 11.3%, up from a cyclical low of 4% in December 2022 and 9.1% a year ago.
Developers completed a wave of large-format logistics space following pandemic-era supply‑chain disruptions, with completions remaining elevated through 2025. Many of those buildings were completed without signed tenants and entered the market as tenant expansion slowed.
More than one-third of the 29 million square feet added to the Puget Sound logistics inventory since the start of the decade remains available, including nearly all the 6.1 million square feet added over the past year.
Some occupiers also began giving back space, even in relatively modern facilities. Sublet listings now account for 13% of available space across the market. That figure holds true even in spaces built since 2020.
While the overall vacancy rate for properties built before the 2020s remains in single digits at 8.6%, speculative construction and space givebacks have pushed the vacancy rate for properties built in the 2020s to above 25%.
Buildings measuring 500,000 square feet or more made up 2.2 million square feet of completed logistics space over the past year, all of which remained available for lease at the start of the second quarter.
Roughly 2.4 million square feet of logistics space remains under construction, with nearly all of it in large-box spaces that are still on the market.

Office attendance in 10 tracked regions averaged 52.2% of the pre-pandemic level for the week ended April 8, according to Kastle Systems.
The security technology firm uses anonymous keycard data from about 2,600 office properties owned by its clients, housing around 41,000 businesses nationwide. The 10-city average has generally remained above 50% for much of the past year, as companies increasingly require in-office work.
The latest figures showed Austin, Texas, remaining well ahead of most other regions at 73.9%, with Dallas at 61.9% and Houston at 56.8%. They were followed by Chicago at 53.7%, New York at 51.6% and Washington, D.C., at 49.9%.

7-Eleven is planning to close hundreds of stores in North America as it doubles down on its goal of selling more food and drinks and delays the planned initial public offering of its North American division.
The world's largest convenience store chain will close 645 stores in the United States, Canada and Mexico during the 12 months that began March 1, according to a financial report issued by Seven & i Holdings, the Japan-based parent company of 7-Eleven. The company did not identify the stores set to close.

Demand for short‑term rentals, or STRs, now capture about 18% of hotel demand nationwide, though their presence across major U.S. markets varies widely based on local conditions.
Among the top 25 hotel markets, STR listings range from less than 10% of hotel inventory in cities such as Minneapolis, Las Vegas, Chicago and New York, to more than 30% in Phoenix, Miami and Orlando. Sun Belt and leisure-oriented markets generally exhibit the highest levels of alternative accommodation penetration, with STR listings exceeding one-quarter of hotel inventory in Phoenix, Miami, Orlando and Oahu, while San Diego and Los Angeles approach that threshold. In contrast, some gateway urban markets, including Washington, Boston and San Francisco, show STR shares closer to or below the mid-teens.
The composition of STR demand further shapes competitive dynamics. One‑bedroom, one‑bathroom units, the STR segment most directly overlapping transient hotel demand, show significantly lower penetration than total listings in most markets. Even in Phoenix, where STR supply is deepest, one‑bedroom, one‑bathroom demand equates to roughly 19% of hotel inventory. In Los Angeles, San Diego and Miami, comparable demand ranges from the low to high teens to the low-20 percent range, while many large urban area fall well below the national average.

More than 67,000 units have been completed in Houston since 2023, roughly 18,000 units are still vacant. The average vacancy hovers near 20% for apartments built in 2024 and almost 60% for those built in 2025."
Austin leads all major Texas metros- share of properties offering concessions, at 74% as of March 2026. The high use of concessions has persisted despite two consecutive years of historic demand in 2024 and 2025, largely driven by extraordinary supply growth that has resulted in a 13.4% vacancy rate, among the highest in the U.S.
Generally, complexes in Uptown are advertising four to six weeks of free rent, including The Christopher. On the other end of the spectrum, that can be extended to 10 to 12 weeks free in outlying towns in Collin County, such as Ascend at Celina Hills, which is offering 10 weeks free and a $500 gift card.

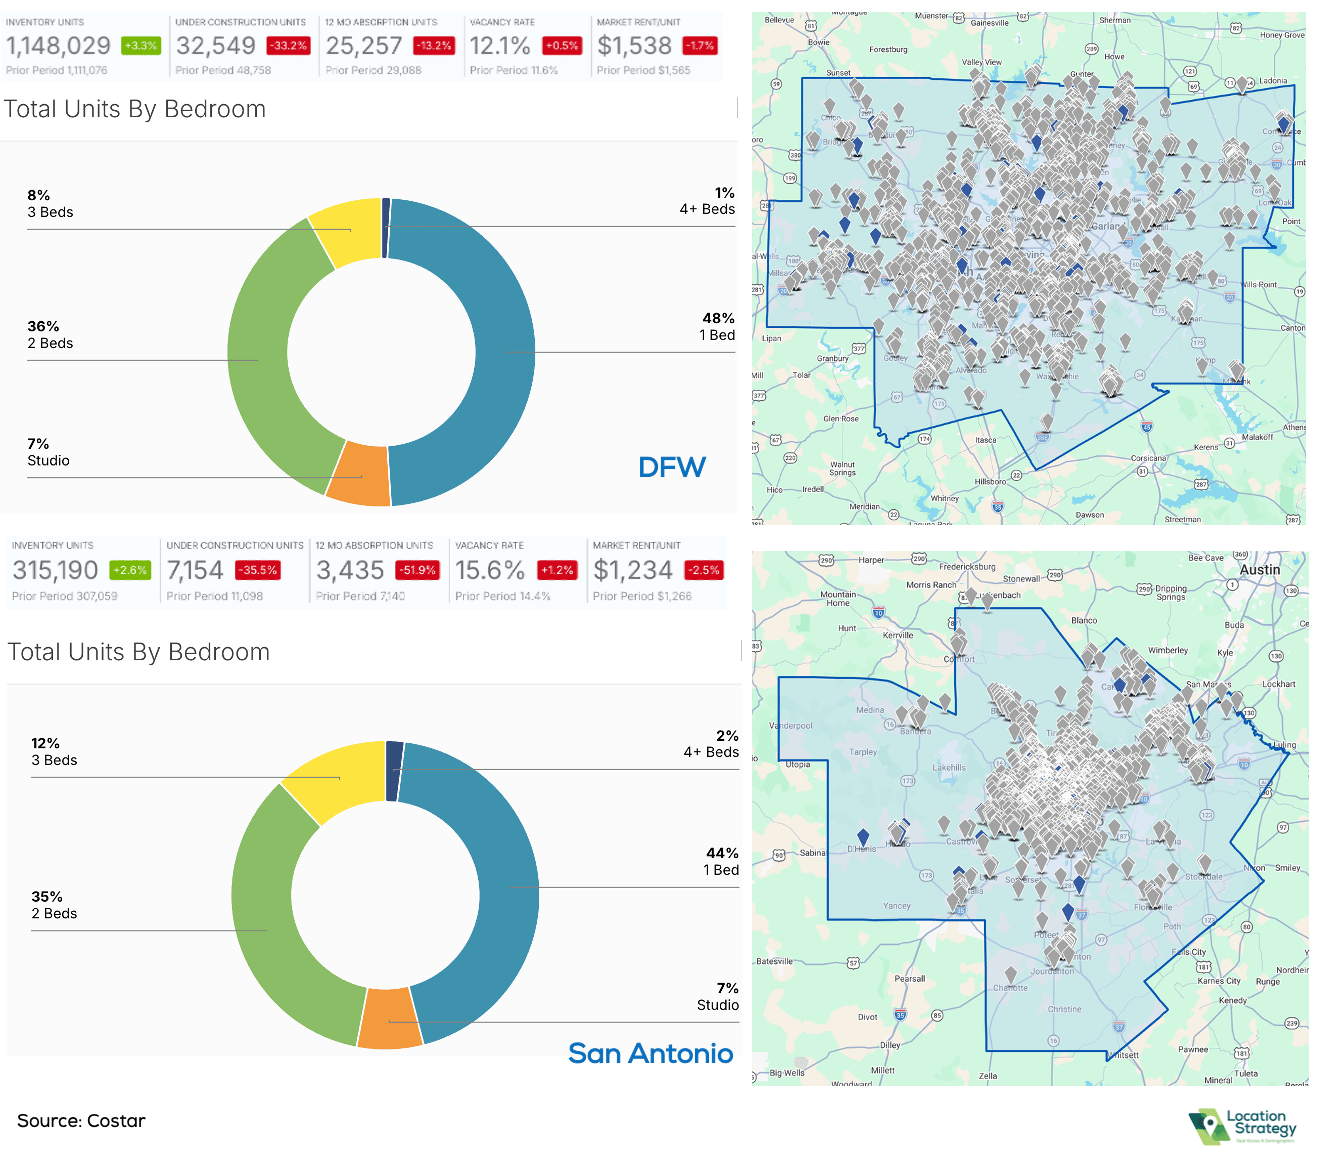
LS Commentary: there is an undersupply of 3+ bedrooms for families, multigenerational living, storage needs, WFH offices, exercise rooms, guest rooms, roommates. Why compete on price in a sea of 1 & 2 bedrooms with higher vacancy, longer lease up, higher turnover and turnover costs, higher incentives?

At the regional level: Year-over-year changes in median list prices by region ranged from -3.6% in the Northeast to -0.1% in the Midwest. When adjusting for changing home sizes, price per square foot, prices rose more robustly in the Midwest (+1.4) and Northeast (+0.4%) compared to the South (-3.5%) and West (-1.4%).
At the metro level: Median list price per square foot is falling in 31 of the top 50 metros. The largest per-square-foot price declines were in Austin (-7.1%), Memphis (-6.3%), and San Antonio (-4.6%). The largest gains were in Providence (+9.8%), Indianapolis (+6.3%), and Milwaukee (+5%).

At the regional level: Inventory increased across the board, with larger gains in the Midwest (+13.6% YoY) and West (+10.6%) than in the Northeast (+7.9%) and South (+5.8%).
At the metro level: 44 of the 50 largest markets recorded year-over-year inventory growth (active listings were down in Orlando, Chicago, Hartford, San Francisco, Miami, and Jacksonville). The sharpest increases were seen in Seattle (+42.5%), Louisville (+34%), and Indianapolis (+27.0%).

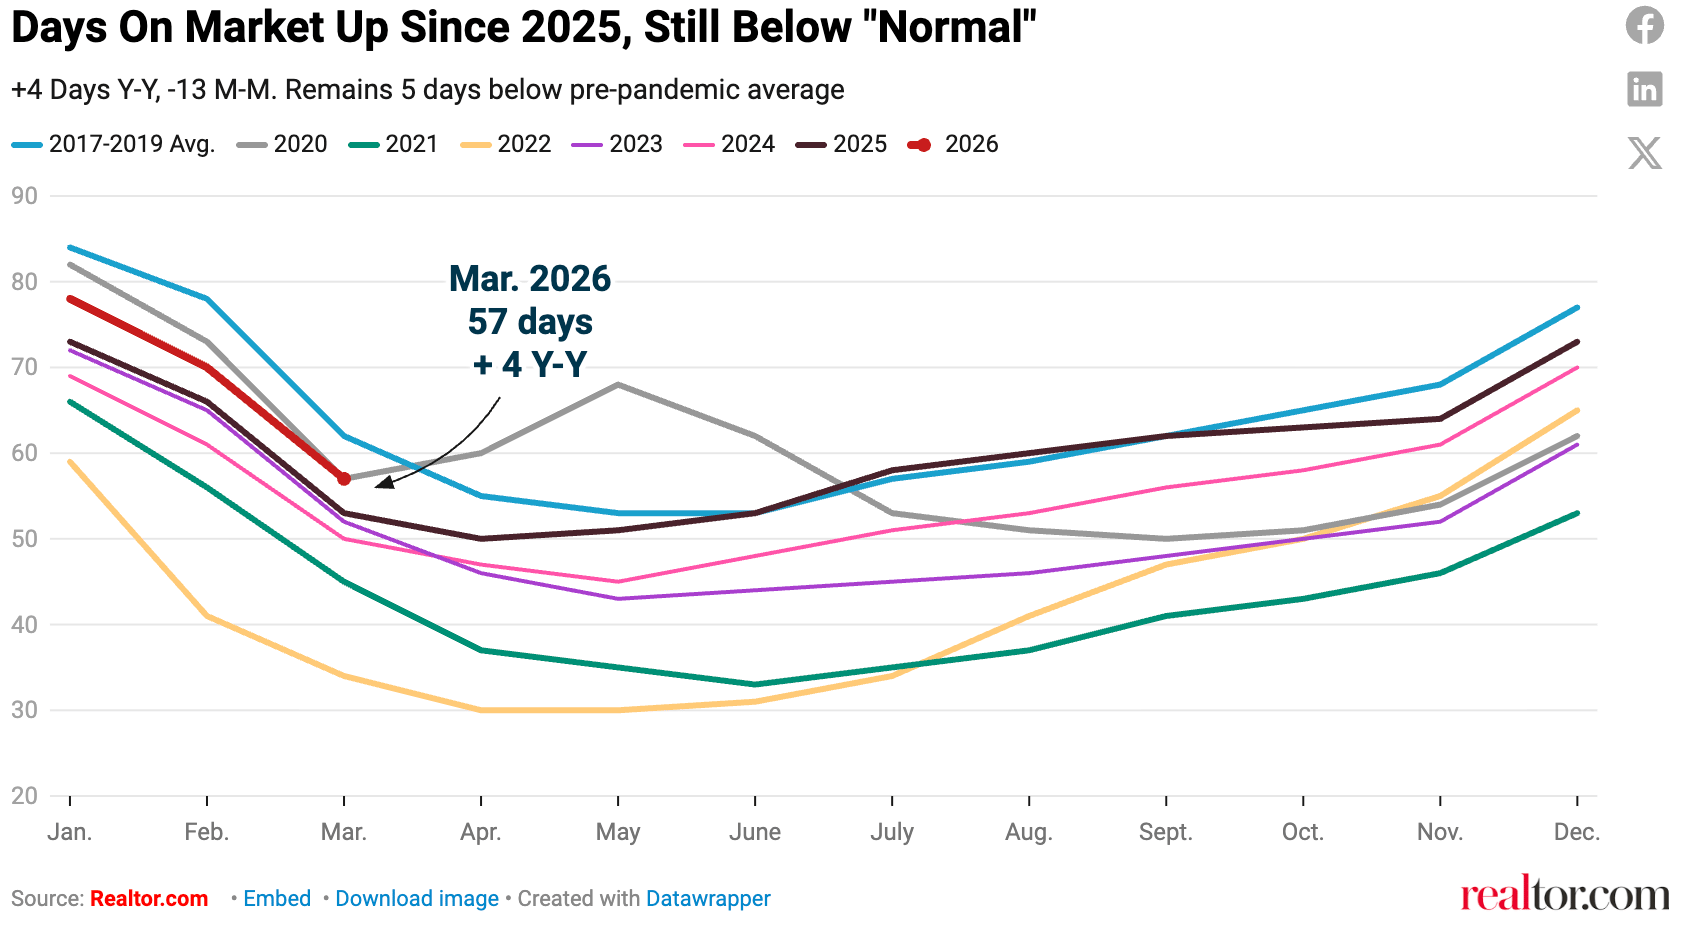
This marks the 24th straight month of homes taking longer to sell on a year-over-year basis. The median home has spent 5 fewer days on market than the pre-pandemic norm
Regional and metro levels: Time on the market was up modestly across the major regions (Northeast, +4 days; Midwest, +2; South, +4; Wes,t +2) and grew in 43 of the top 50 metros (up from 35 last month).