- Location Strategy Chartbook
- Posts
- Location Strategy Chartbook 041324
Location Strategy Chartbook 041324
Location Strategy
April 13, 2024

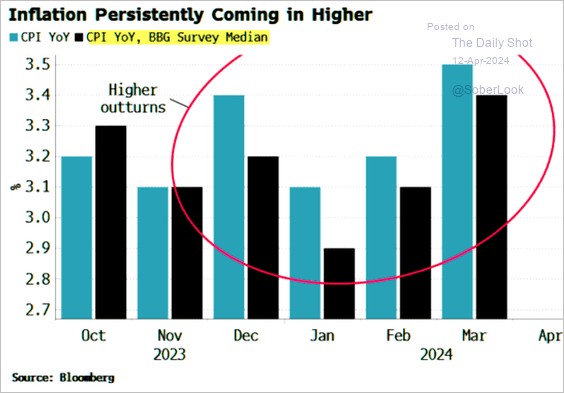
The March CPI report exceeded expectations, suggesting that inflation remains sticky and achieving a 2% rate may take longer than many economists initially projected.
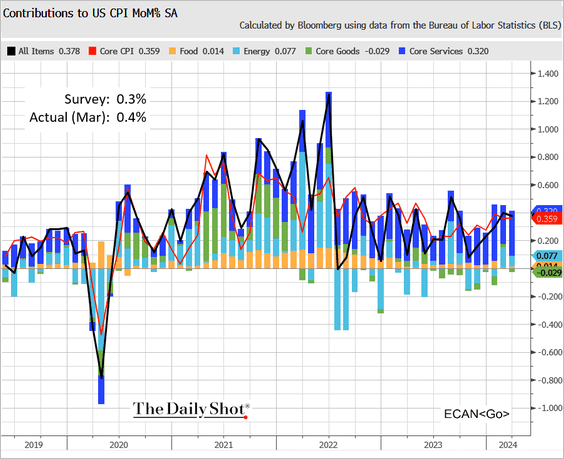
Here are the monthly changes in the core CPI without the seasonal adjustments.
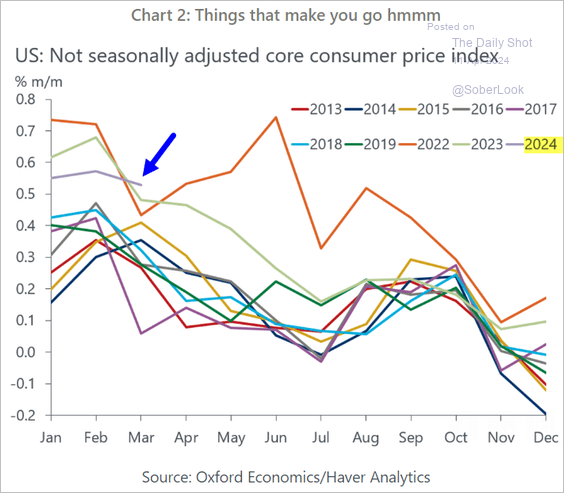
US inflation has been surprising to the upside in recent months.
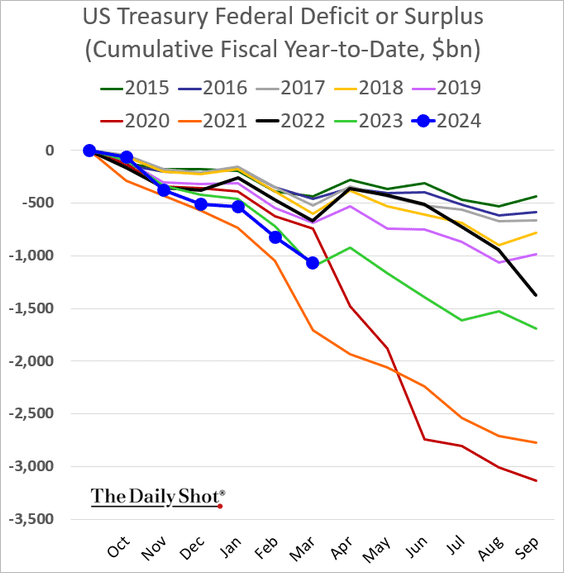
One more reason to expect more inflation: The cumulative federal budget deficit is roughly in line with 2023 levels for this time of the (fiscal) year.
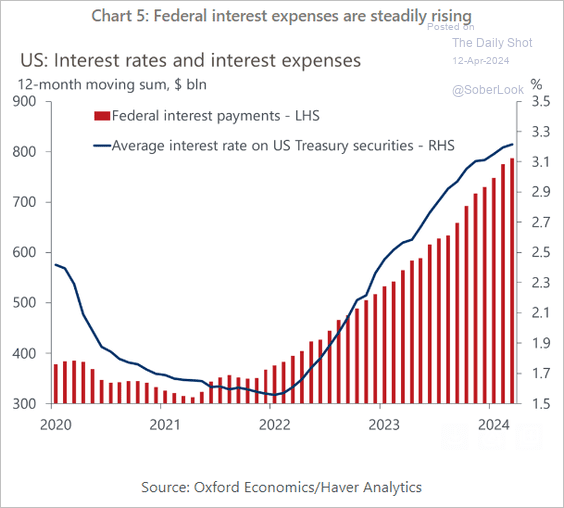
Interest expenses continue to climb. This is still the best reason in our minds to expect interest rate cuts this year.
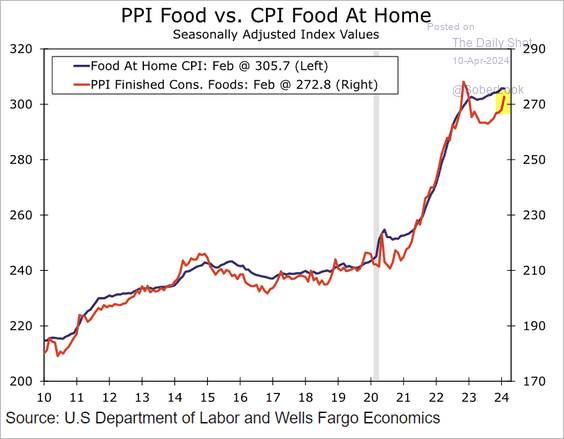
The PPI data signals a pickup in the rate of food inflation.
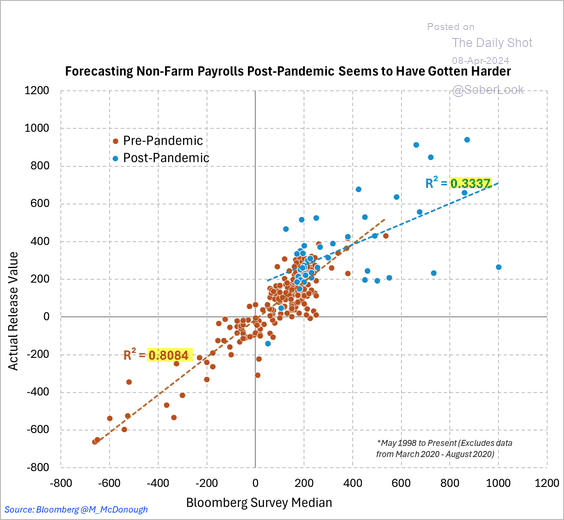
Forecasters have faced challenges in accurately estimating job gains during the COVID era.
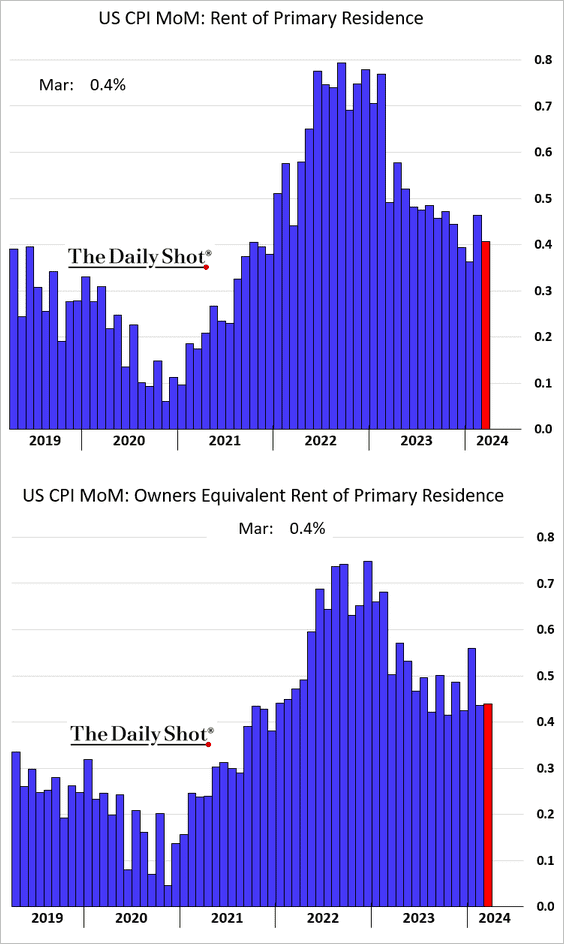
House price gains remain elevated - although the OER is a horrible measure of home prices and typically trails actual transactions by 6-9 months. We won't be surprised to see that housing price inflation is overstated.
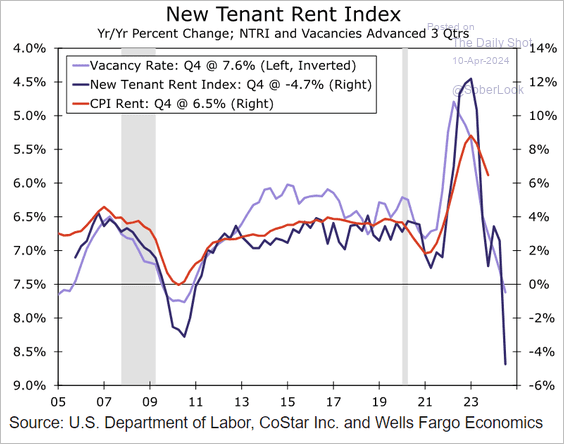
Rent declines: the chart shows a clear example of how federal figures (red) lag private, transaction-based indices. In fact the New Tenant Rent Index is the clearest indicator of where rents are; they would include concessions necessary to put new tenants into units.
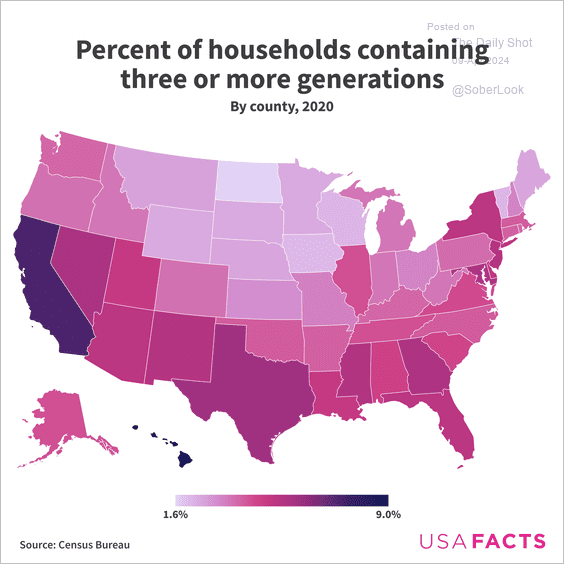
Households with three or more generations:
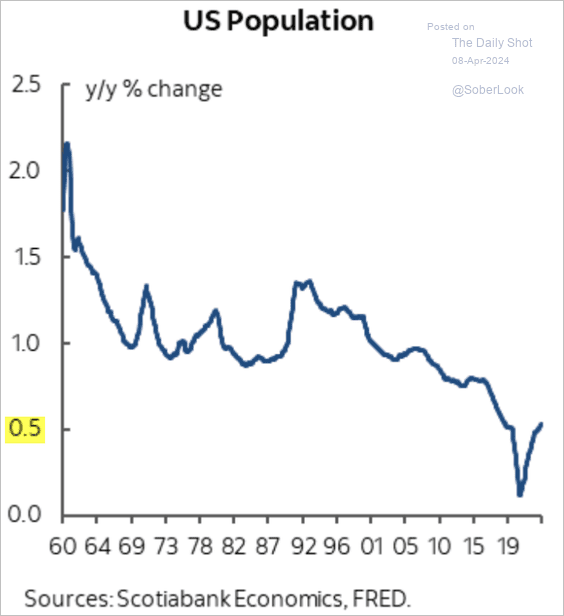
There is talk of rising immigration driving job growth without hastening inflation. While growth in foreign-born population has rebounded, …
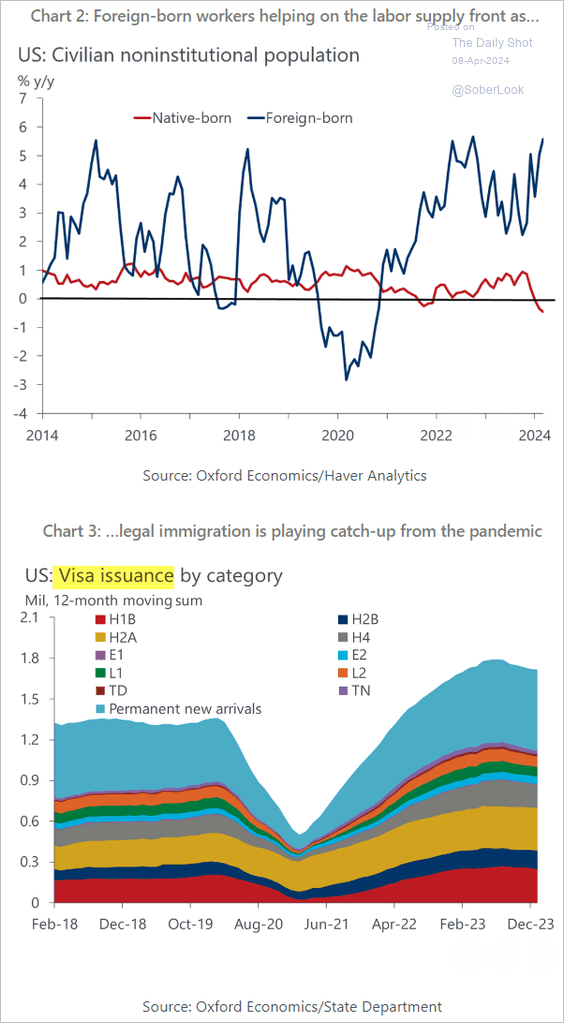
… the overall population is still growing at only 0.5% per year. The rebound in the chart below was driven by increased immigration as well as fewer people dying from COVID.
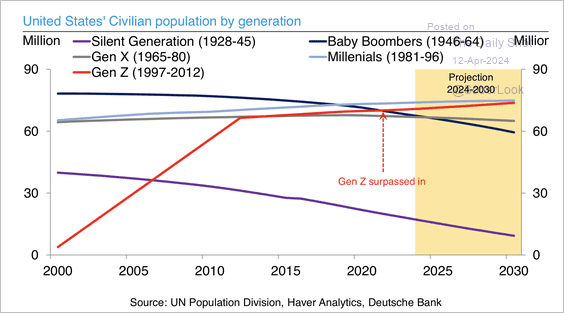
Gen Z now outnumbers baby boomers.
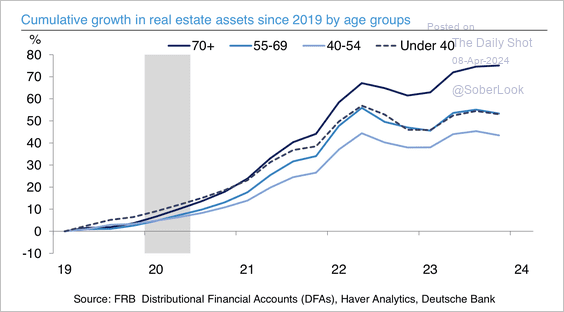
The oldest age group has experienced the largest rise in real estate assets over the past five years.
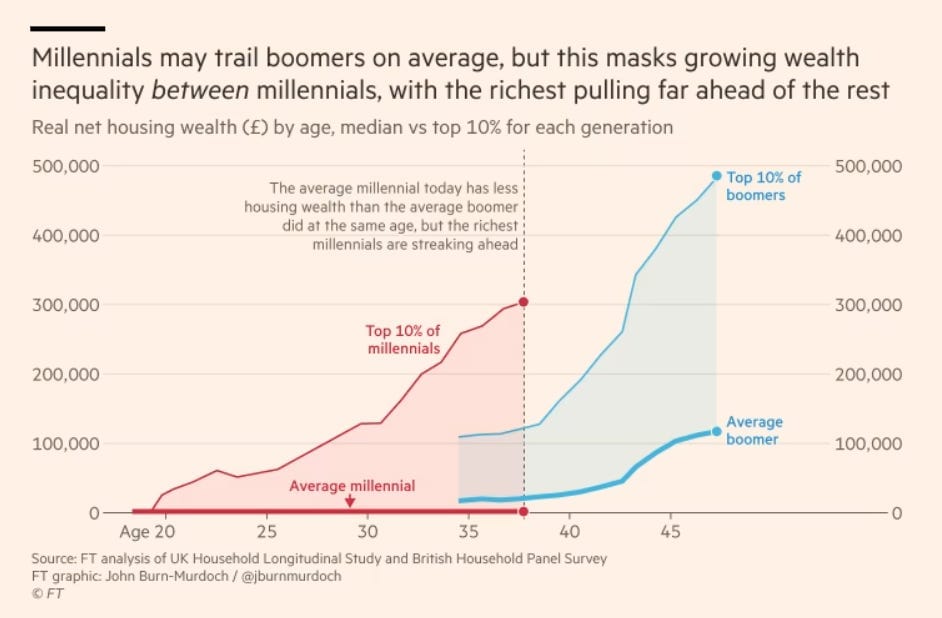
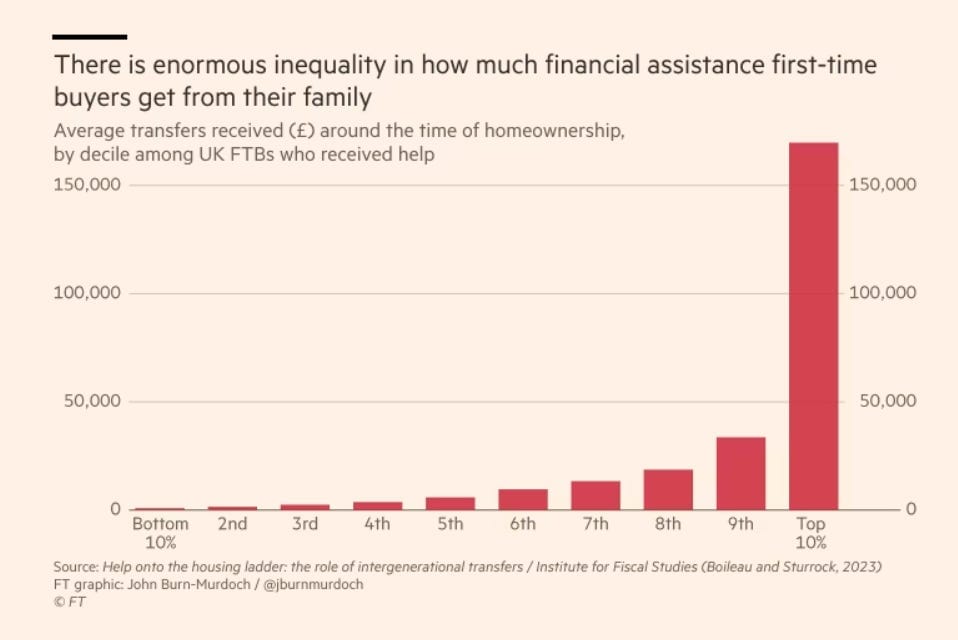
Interesting data on housing inequality from the UK. We hear complaints about inequality between Boomers and Millennials all the time. But how about the gap inside the Millennial generation? Top Millennials are zooming head, largely because of family help.
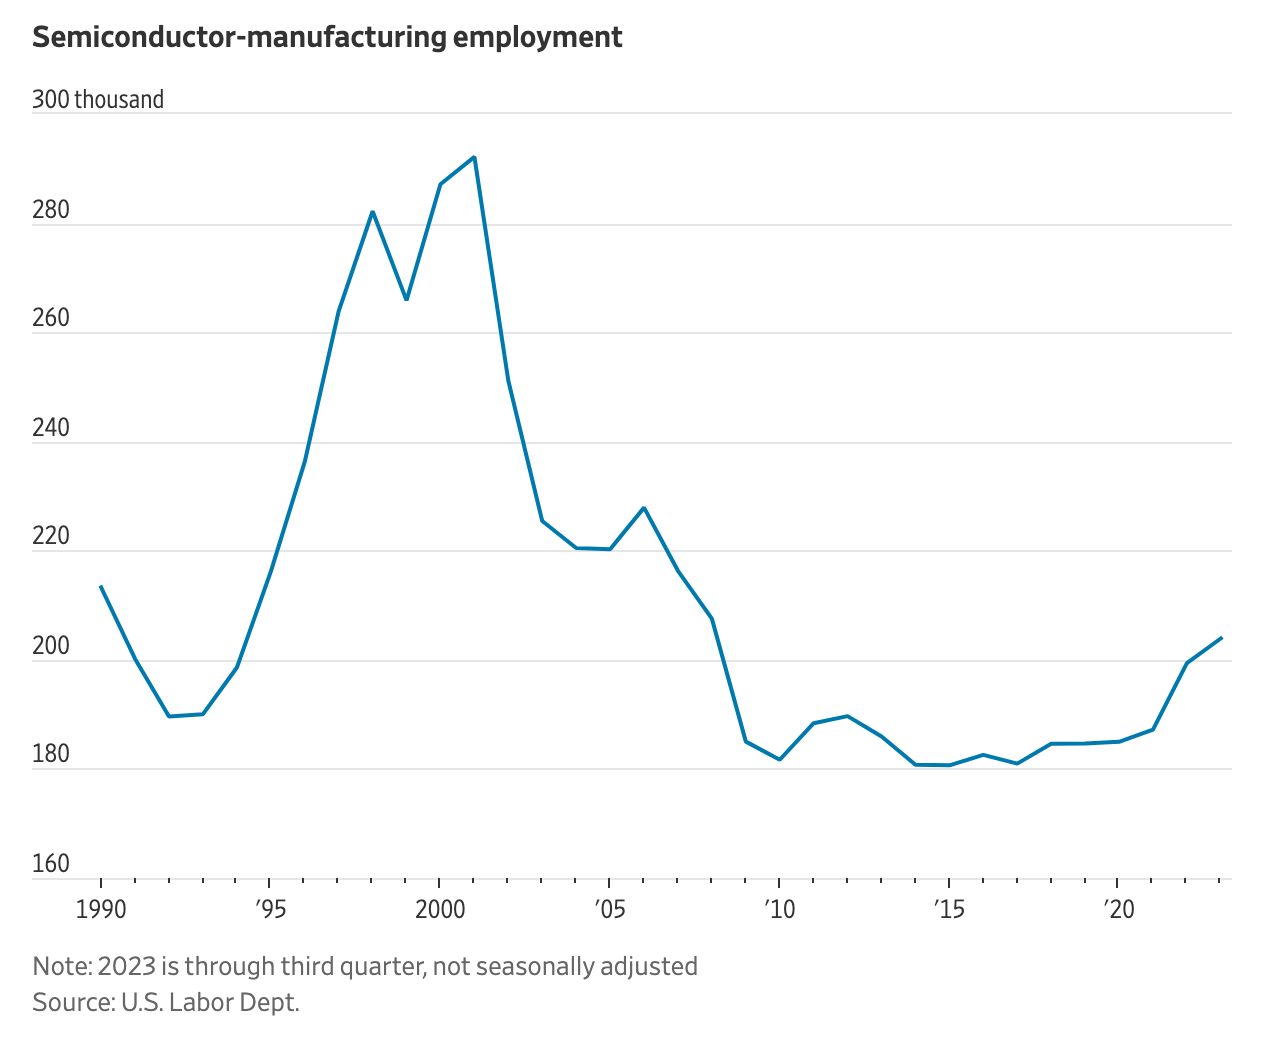
The U.S. is trying to do something unprecedented: reverse a shrinking share in a key manufacturing sector. Between 1990 and 2020, the U.S. share of world chip making shrank to 12% from 37%, while the combined share of Taiwan, South Korea and China grew to 58%.