- Location Strategy Chartbook
- Posts
- Location Strategy Chartbook 10.11.2025
Location Strategy Chartbook 10.11.2025
Real Estate Market Insights
Bloomberg: Debasement fears seem to be everywhere—except the one place they should be most obvious: bonds. Sure, there was a nudge up in global long-end yields this week, thanks to politics. Japan’s ruling party picked a leader who likes big spending and low rates, and France lost yet another prime minister after failing to reconcile the need to save money with a parliament that disagrees. Yet, the bond markets remain confident that U.S. inflation won’t run out of control, even as investors point to soaring gold prices as a sign of fear that politicians and central banks will choose inflation as the easy way out of debt problems. How come? Well, bond markets are split between worrying that a U.S. jobs slowdown portends weak growth and fear that politicians pouring fuel on the smoldering embers of inflation will eventually stoke another fire.
Some aspects of the markets fit the idea that debt will be inflated away (the modern version of debasing the value of gold coins with base metals). Gold just passed $4,000, up 51% in 12 months. The dollar is down more than 10% from January’s high against a basket of major currencies. Stocks, which provide some protection from inflation as revenue rises with prices, are setting new highs. But if investors expect debasement, it is very odd that the bond market’s best guess at long-run inflation—the so-called break-even inflation rate for the five years starting in five years’ time—is basically unchanged, and close to the Fed’s 2% target.

Rising tariff revenues and declining interest costs are helping the government's fiscal profile more than initially expected, according to our strategists. Customs duties have surged and are likely to rise further as the effective average tariff rate is expected to increase from 11% currently to 15%. That would add an additional $300 billion in revenues annually, helping government finances. As the Federal Reserve has started cutting short-term rates, yields on Treasury bills and short-term bonds have declined significantly as well.
Markets are now pricing the policy rate to fall to around 3% in a year's time, as opposed to staying close to 4%, as was expected at the beginning of the year. As short-term debt accounts for a bigger portion of the total these days, the savings from lower yields will shave off 1.3 percentage points of GDP from annual deficits, our strategists estimate. With those two factors at work, budget deficits should decline to below 6% of GDP. In contrast, earlier this year deficits were expected by many observers to swell to 7-8%. That would mean the government debt-to-GDP ratio would only rise from about 100% currently to 116% in 10 years, much lower than the 130% projected a few months ago.

The growth of global goods trade is expected to slow sharply next year, according to the World Trade Organization. The WTO said merchandise trade volumes are forecast to rise 2.4% this year, but expects a 0.5% rise in 2026, attributing the expected slowdown in 2026 to the delayed drag on international commerce from US President Donald Trump’s trade war.

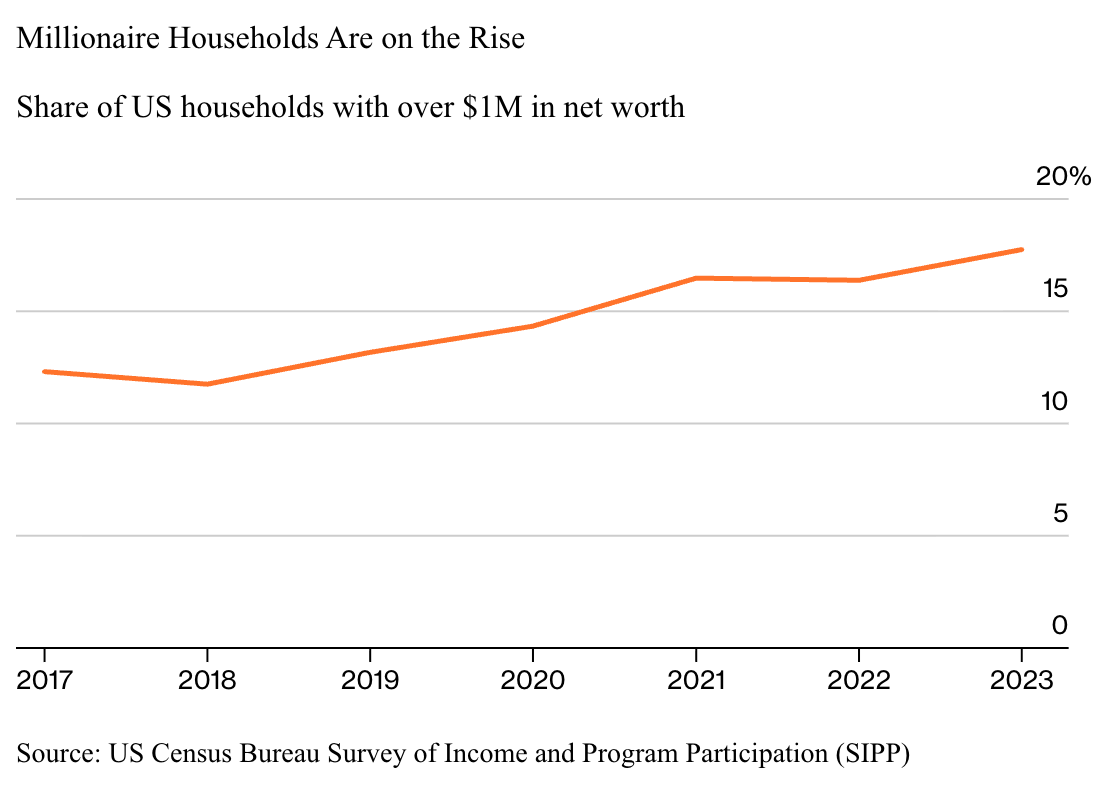
At the height of the Gilded Age, there were 4,047 millionaires in the US, according to an 18-month investigation by the long-gone New-York Tribune, which listed each by name in a special edition published in 1892.
Today the number of millionaire households is more than 24 million, or almost one in five US households, according to a Bloomberg analysis of government survey data through 2023. Fully a third of those modern millionaires have been minted since 2017, as home values and the stock market surged. That doesn’t mean they’re walking around flush with cash.
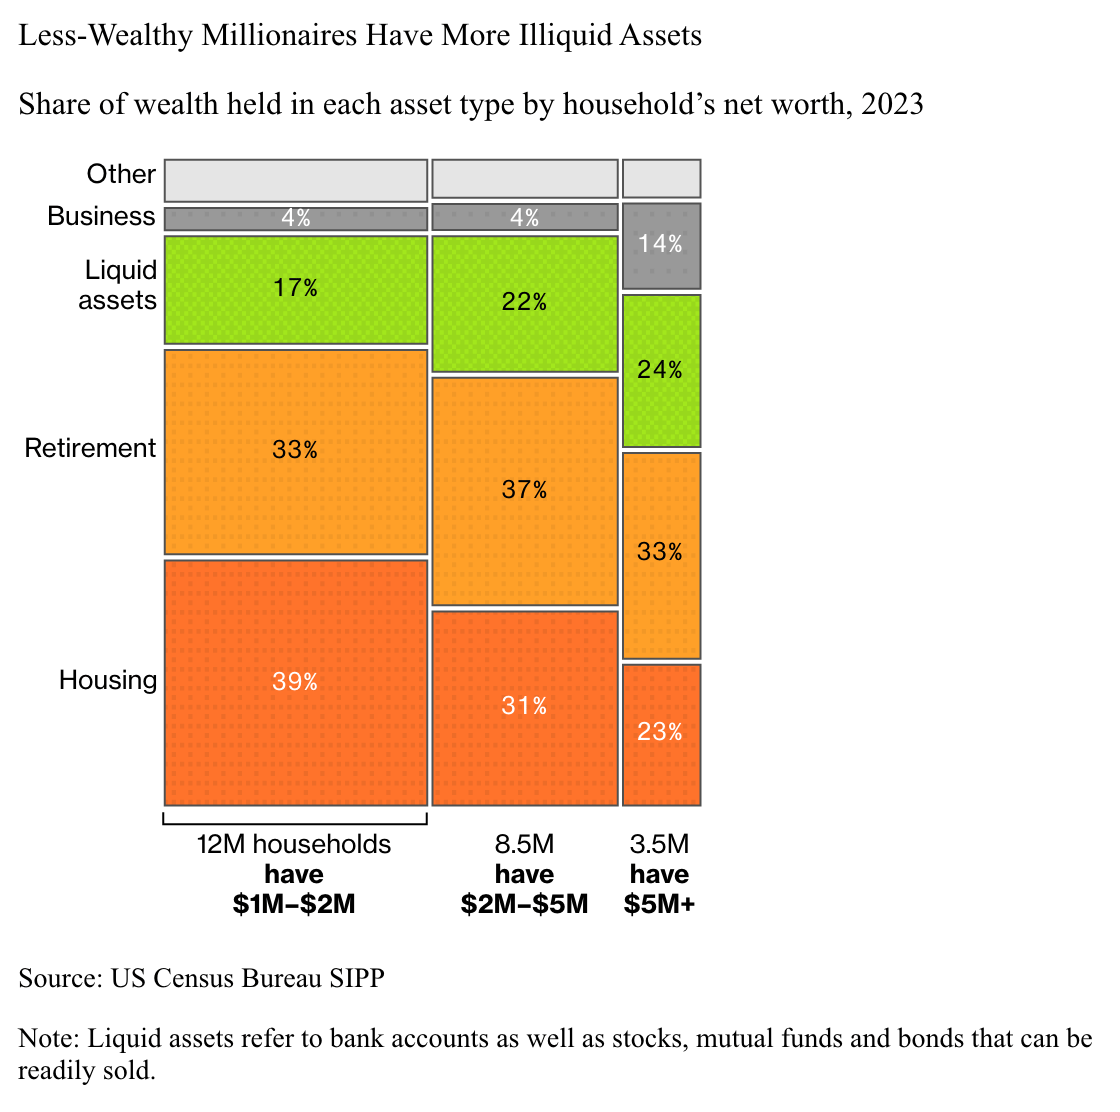
Instead, more and more of millionaires’ wealth is locked up in assets that can't be accessed quickly or easily, like home equity or, increasingly, age-restricted retirement assets like 401(k) and IRA accounts. Add in the effects of inflation and higher interest rates, and financial advisers say $1 million no longer assures a secure retirement, much less a golden ticket to the plutocracy. The $1 million threshold used in the analysis takes into account debt and other liabilities.
For the barely-millionaires, households with a net worth between $1 million and $2 million, the vast majority of that wealth is illiquid. They typically had 66% of their wealth tied up in a primary home and retirement accounts in 2023, an increase of eight percentage points since 2017. To spend freely, millionaires typically need to be a lot richer. Households with $5 million or more had about 24% in easier-to-access bank or brokerage accounts in 2023, compared to 17% for those closer to the $1 million mark.
Even as the latest data show the number of US millionaires jumping by 50% in six years, they face an array of factors making their wealth harder to deploy. Higher interest rates, for example, have compounded liquidity issues. To raise cash for a significant expense, investors and homeowners can usually borrow against their assets, but the costs have risen significantly. Rates on home equity lines of credit, or HELOC loans, averaged 7.89% in Bankrate’s most recent survey of the largest lenders, roughly double what homeowners paid in early 2022. Margin loans at major retail brokerages such as Fidelity, Vanguard and Charles Schwab now start at 10% or 11%, varying based on the size of portfolios.
A “paper millionaire” can always sell assets outright. These days, though, they have more reasons to be reluctant. Selling a home entails not only major hassles and transaction costs. Homeowners also need to find somewhere else to live at a time when the affordability of US housing has plunged. Moving may mean giving up a mortgage rate far lower than what’s available today. Even if they hold significant assets outside of their home and age-restricted retirement accounts, getting at that wealth can be tricky. Clients with large stock gains can find that selling triggers huge tax bills, advisers warn.
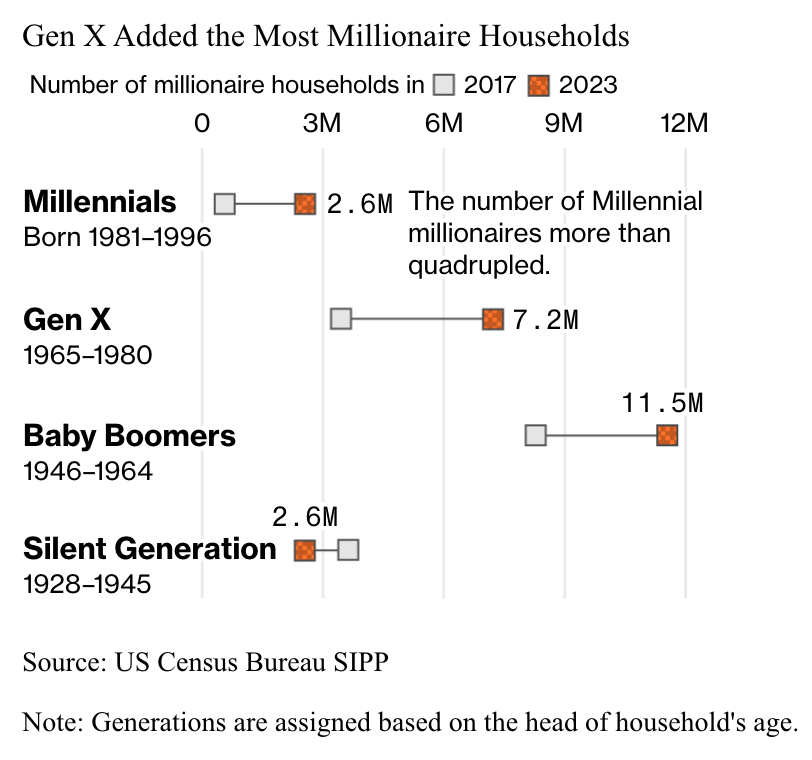
There's a wide discrepancy between the number of millionaires in each generation and the division of their wealth. Only the number of millionaires born before 1946 has declined as the Silent Generation passes away. Meanwhile, older Americans have had more time to build up 401(k) or IRA nest eggs, which they generally can tap freely starting six months before their 60th birthday. Millennial millionaires have only about 27% of their wealth in retirement accounts, Bloomberg’s analysis shows, compared to 37% for Baby Boomer millionaires.
Back in the spring of 2022, when employers were dangling raises and bonuses, a record share of private sector workers quit. That’s been declining steadily and matched a multiyear low in August.
When asked how they feel about the economy, people tell sentiment survey-takers all kinds of things, if they even answer the phone.

The city’s median household income stands at approximately $82,000, closely aligned with the national average of $81,000. At this income level, renters in Houston allocate about 20% of their annual pre-tax income toward rent — significantly below the national average of 26%.
Over the past three years, income growth in Houston has consistently outpaced rent increases. Following the pandemic, demand surged, driving rent growth to 8% in 2021, far above the 1.8% annual average recorded between 2015 and 2019. However, by mid-2022, rent growth began to decelerate — initially due to inflationary pressures dampening demand — and more recently, due to a substantial influx of new supply.
Since 2023, over 60,000 units have been completed, narrowing the supply-demand gap. Despite this, competition remains intense, and rent growth turned negative in the second quarter of 2025 for the first time since 2010, with a year-over-year decline of 0.7%.
From the first quarter of 2020 to the third quarter of 2025, Houston’s median household income rose by 19%, from roughly $69,000 to $82,000, while asking rents increased by 13%, climbing from $1,217 to $1,374 per month.

The Los Angeles multifamily supply pipeline is experiencing a deceleration following an extended period of heightened activity. Over the last 10 years, net deliveries averaged approximately 9,900 units annually, which is more than double the previous decade’s average (2006-2015) of 3,900 units per year. Similarly, the average number of units under construction each year reached around 101,000 in the past decade, nearly three times the 36,000-unit annual average reported between 2006 and 2015.
Currently, 82,000 units are under construction, representing the lowest volume since 2016. Construction starts have declined by approximately 20% annually since 2022, with only 6,200 units started in the most recent 12-month period — the lowest figure observed since 2010. The reduced pace of supply will allow demand to catch up; over the last decade, about two units were built for every one renter. This imbalance has resulted in vacancy rates rising to 5.3%, which is the highest level recorded in the past 10 years excluding 2020.
LS Comment: is this a reflection of market conditions or is it due to the environment where it is increasingly difficult to build due to government regulation and bureaucracy that causes major delays in building and costly changes + local government inhibits operating MF profitably? IE: LABDS inspections/continual government forced upgrades, difficult to evict/eviction moratoriums, ULA


U.S. monthly apartment rent growth declined last month in its deepest September drop in more than 15 years as excess supply affected all parts of the country.
The national average rent in the U.S. fell to $1,712, a 0.3% decrease from August’s revised figure of $1,717, and the decline marked the third consecutive month of no change or a decline in monthly rent, according to a report from CoStar's Apartments.com.
While multifamily rent growth usually follows a seasonal pattern of increases in the spring and a deceleration in late summer and fall, "the recent year-over-year slowdown — which adjusts for seasonality — signals a more pronounced softening in the market.”
An abundance of available apartments is affecting the ability of landlords to push rents higher.
"Although many markets have moved beyond peak supply, a substantial inventory overhang continues to weigh on rent growth nationwide," the report said.
All U.S. regions posted declines in rent in September, with the West leading the country with a 0.5% month-over-month decrease, followed by a 0.4% slide in the South, a 0.2% drop in the Northeast, while rents in the Midwest fell 0.1%..
On an annual basis, the Midwest posted the strongest performance in the country with 2.4% growth, followed by the Northeast at 1.9%.
The South also posted a slight increase, with rents rising 0.1% year-over-year, though they declined 1.3% in the West.
Markets with the highest levels of new construction had the weakest rent performance as more supply-constrained metropolitan areas, especially those in the Midwest and select coastal regions, continued to outperform.
San Francisco led the nation with 6.1% annual rent growth, followed by San Jose, California, and Chicago at 3.8%, and Norfolk, Virginia, at 3.1%, the report said.
On the flipside, annual rents in Austin, Texas, declined 4.4% and fell 3.8% in Denver, while Phoenix and San Antonio posted drops of 2.9%, as supply outstripped demand.

Most of America’s largest homebuilders have publicly stated that the peak 2025 housing market saw softer-than-expected conditions, particularly in many parts of the Sun Belt. This softer housing market environment caused unsold inventory to tick up. Indeed, since the Pandemic Housing Boom fizzled out, the number of unsold completed U.S. new single-family homes has been rising:
August 2016 —> 61,000
August 2017 —> 63,000
August 2018 —> 69,000
August 2019 —> 79,000
August 2020 —> 52,000’
August 2021 —> 34,000
August 2022 —> 45,000
August 2023 —> 72,000
August 2024 —> 105,000
August 2025 —> 124,000
The August figure (124,000 unsold completed new homes) published last week is the highest level since July 2009 (126,000).
