- Location Strategy Chartbook
- Posts
- Location Strategy Chartbook 11.01.2025
Location Strategy Chartbook 11.01.2025
Real Estate Market Insights
Layoffs announced recently, these are not just US based jobs, but globally where relevant:
UPS: 48,000
Amazon: 14,000-30,000
Intel: 24,000
Nestle: 16,000
Accenture: 11,000
Oracle: 11,000
Ford: 11,000
Novo Nordisk: 9,000
Chevron: 6,000-8,000
Microsoft: 9,000
PwC: 5,600
Salesforce: 4,000
Lufthansa: 4,000
Meta: 3,600
ConocoPhillips: 2,600-3,250
Paramount: 2,000
Target: 1000-1,800
Sika: 1,500
Kroger: 1,000
Block: 1000
Applied Materials: 1,444
100s: Starbucks, GM, Google, xAI, Rivian, NASA, Cargill
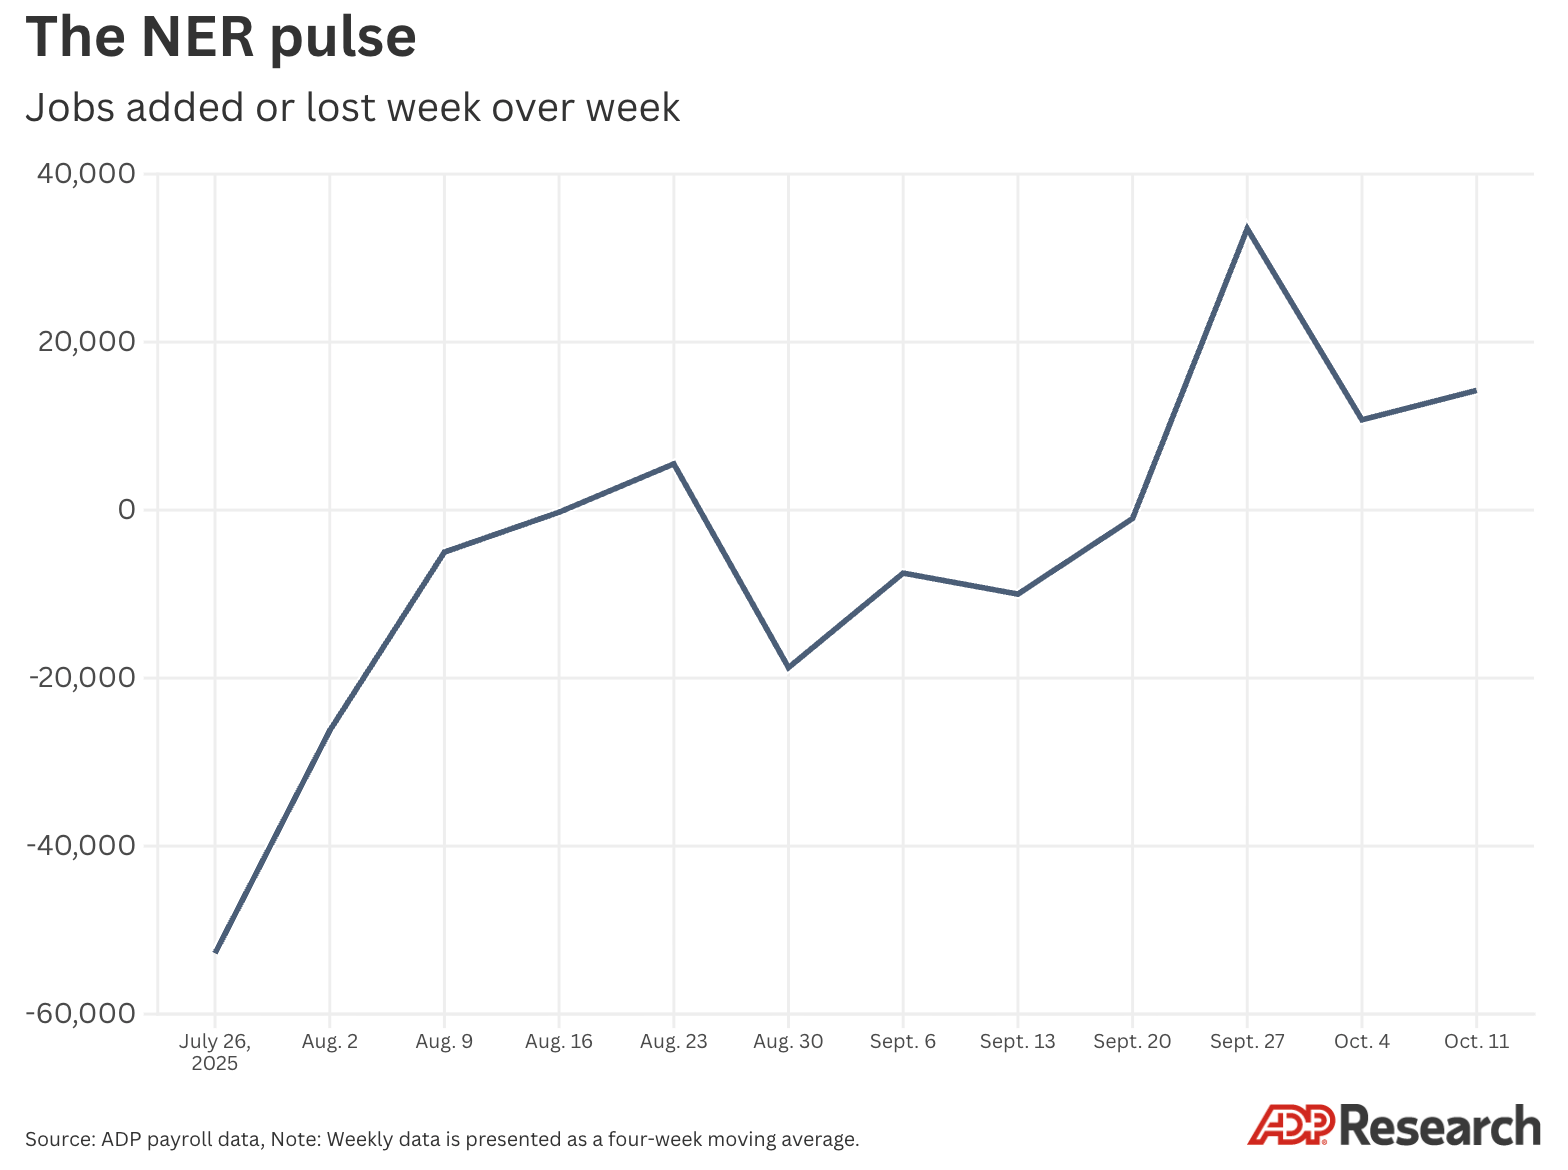
For the four weeks ending Oct. 11, 2025, the NER pulse shows that private employers added an average of 14,250 jobs per week.
This growth in employment suggests that the U.S. economy is emerging from its recent trough of job losses. Hiring has begun to increase from September levels, albeit slowly and without the positive momentum we saw earlier in the year. This tepid recovery could support economic growth, however, because our run of week-over-week job losses seems to have been relatively short-lived.
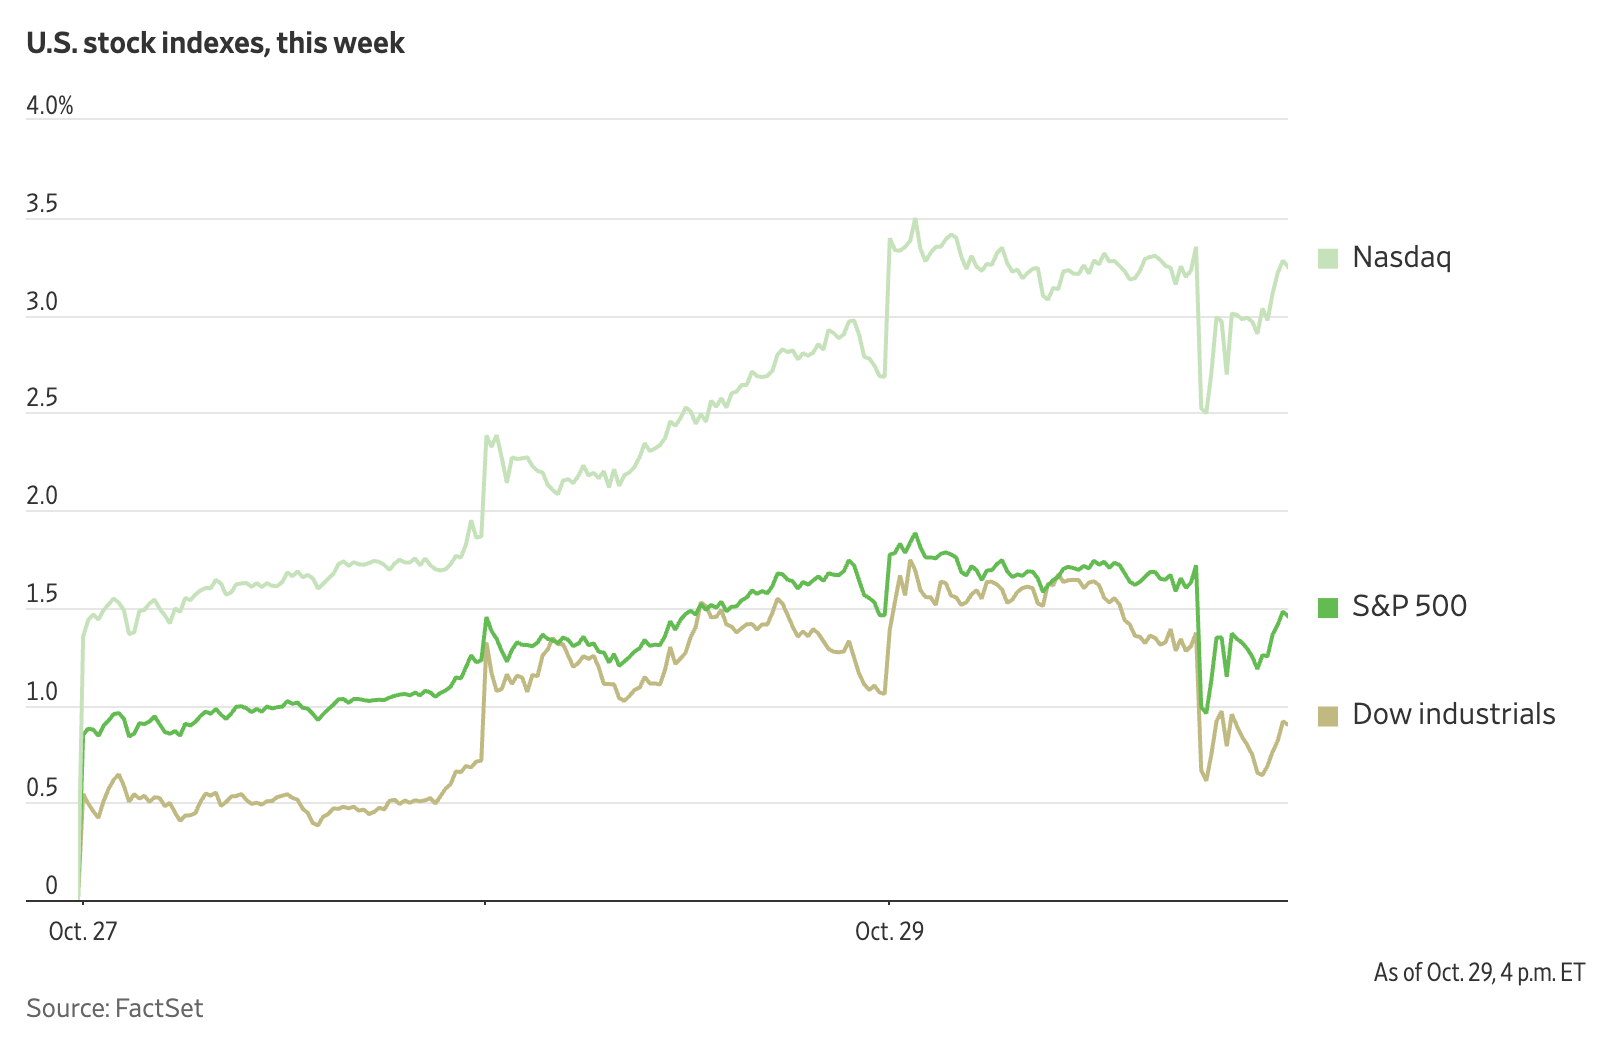
WSJ: The Federal Reserve cut interest rates by a quarter point, but the Dow industrials turned lower after Fed Chair Jerome Powell said there was vigorous debate at the central bank about another cut.
"A further reduction in the policy rate at the December meeting is not a foregone conclusion—far from it," Powell said. "Policy is not on a pre-set course."
The Fed's rate decision drew dissents on both sides, one pushing for rates to be cut further, the other calling for them to remain higher.
Millennials are embracing alternative investments such as real estate and private equity more than other generations, according to a Goldman Sachs Asset Management survey.
Millennials allocate an estimated 20% of their assets to alternatives compared to about 11% or less for other generations, according to the survey of 1,000 US-based high-net-worth individuals with at least $1 million in investable assets. The survey was published in Asset & Wealth Management’s report “Opening the Door to Alternatives.”
The “new alts generation,” as the report calls them, are also less exposed to the stock market than their parents, with just 27% of their portfolios committed to public equities, compared to 48% for baby boomers.

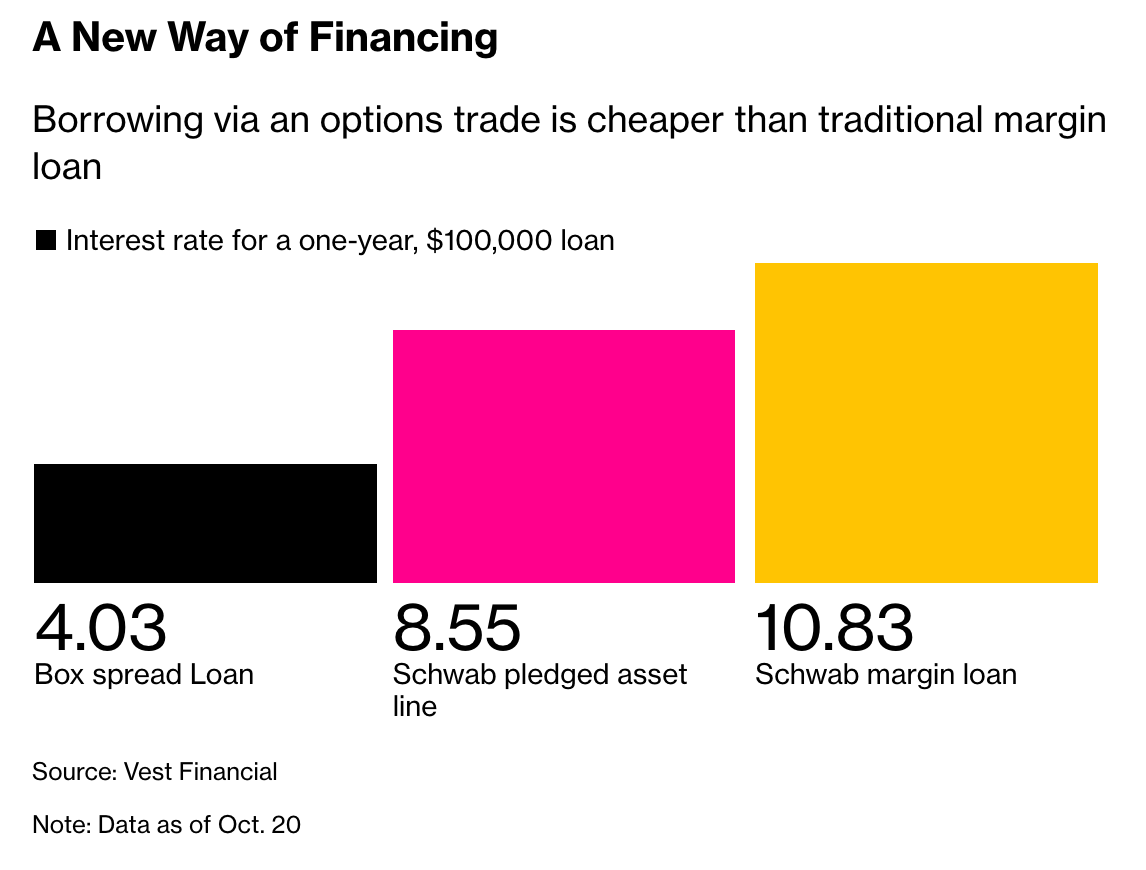
In late 2021, as the housing market overheated and the Federal Reserve’s benchmark interest rate hovered near zero, Tony Yang found an unconventional way to fund his down payment.
He logged into his Charles Schwab brokerage account, built a trade he’d discovered on Reddit — and unlocked about $650,000 to help finance a Bay Area home.
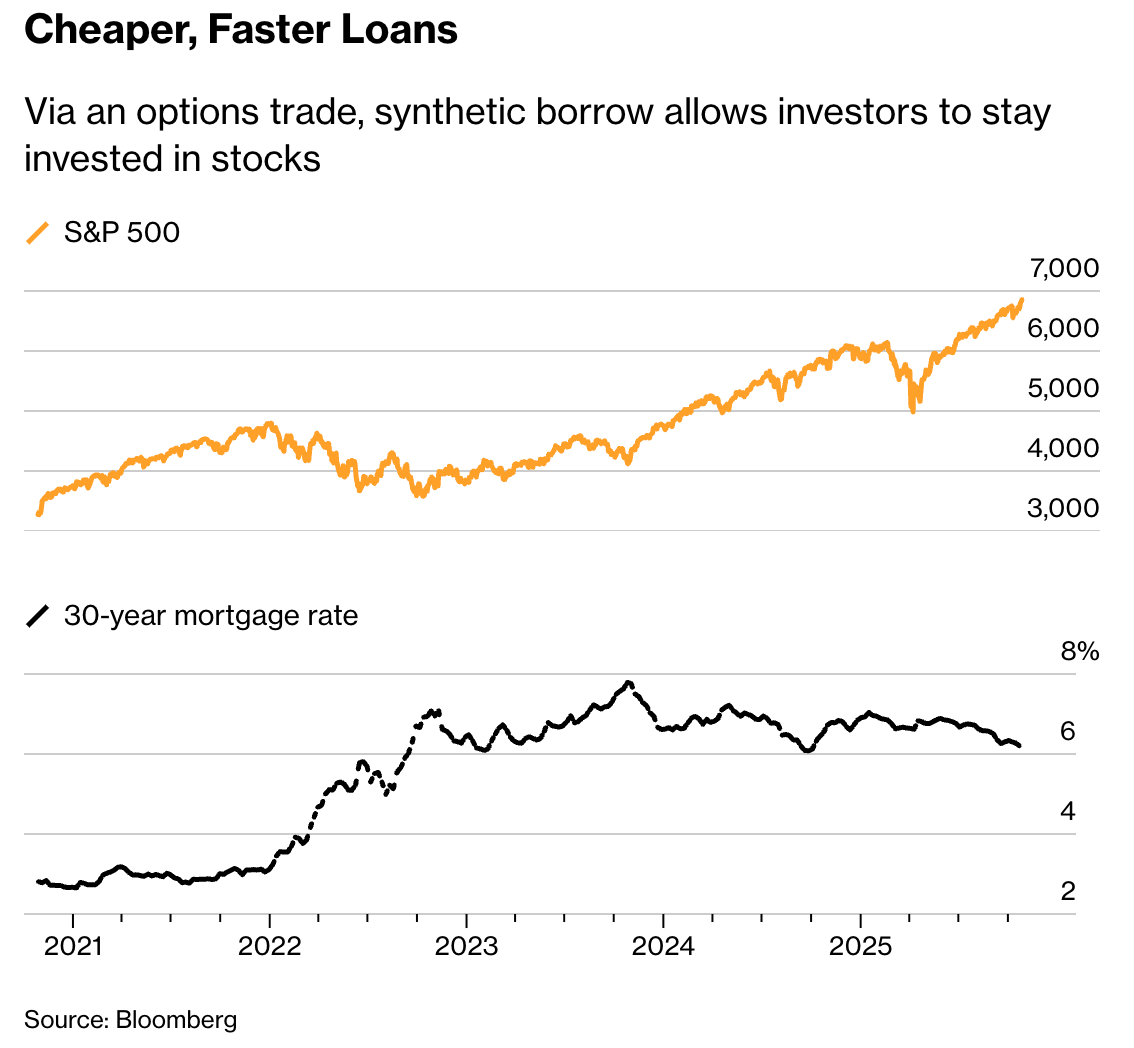
The trade, a “box spread,”. By combining two opposing options positions — one bullish, one bearish — Yang built a strategy that mimics a fixed-rate loan: upfront cash now, repayment at a set date, and a locked-in cost in between. Yang used it to borrow at just 1.6% for five years — well below the rate on his traditional mortgage — creating a down payment without having to sell assets he wanted to keep in the market. “Borrowing against it keeps me in the market and avoids capital gains tax.” Now, that same strategy powers SyntheticFi, a San Francisco-based fintech Yang co-founded to help others do the same. Box spread loans, also called synthetic borrowing, aren’t accessible to every buyer. They require sizable portfolios to back them. But for those with the assets, they offer speed, flexibility, and often a lower cost than traditional bank credit — plus potential tax advantages.
Once a tool for hedge funds and family offices, box-spread loans now sit alongside direct indexing, custom portfolios, and options overlays — all pitched as tax-efficient ways to gain financial control. For affluent investors, they’re a means to stay invested, defer taxes, and unlock liquidity without touching traditional lenders.
Insurers have increased rates significantly for next year — an average of about 30 percent for a typical plan in the 30 states where the federal government manages markets, and an average of 17 percent in states that run their own markets, according to a new analysis from KFF, the health research group.
But the biggest impact for nearly all Americans covered by Obamacare plans will occur with the expiration of generous subsidies at the end of the year unless Congress extends them. Prices on the government’s website reflect that change using calculations based on a return to the lower subsidy levels offered before 2021. The extra funding helped make insurance effectively free for poorer Americans and offered financial help for the first time for people earning more than four times the federal poverty level, or about $64,000 for a single person. If the funding expires, costs will go up for more than 20 million Americans who currently buy their own insurance in the marketplaces established under the Affordable Care Act. Most customers will still qualify for federal help, but at a lower level established under the original program.

KFF: 22 million out of 24 million marketplace enrollees currently receive a tax credit. The amount subsidized enrollees pay is not what insurers charge, but rather a sliding-scale share of their household income, based on a formula set by Congress. If Congress extends the enhanced tax credits, the amount subsidized enrollees pay each month will remain about the same, even though the amount insurers are charging is increasing sharply.
The average cost of a family’s annual health insurance premium has jumped +6% YoY in 2025, to nearly $27,000, an all-time high.
This marks the 3rd consecutive annual increase, following 2023 and 2024 gains of +7%.
Since 2000, the average health insurance premium has surged +350%.
Small businesses are seeing the largest health-rate increases, with over half reporting +10% or more premium hikes in 2025.

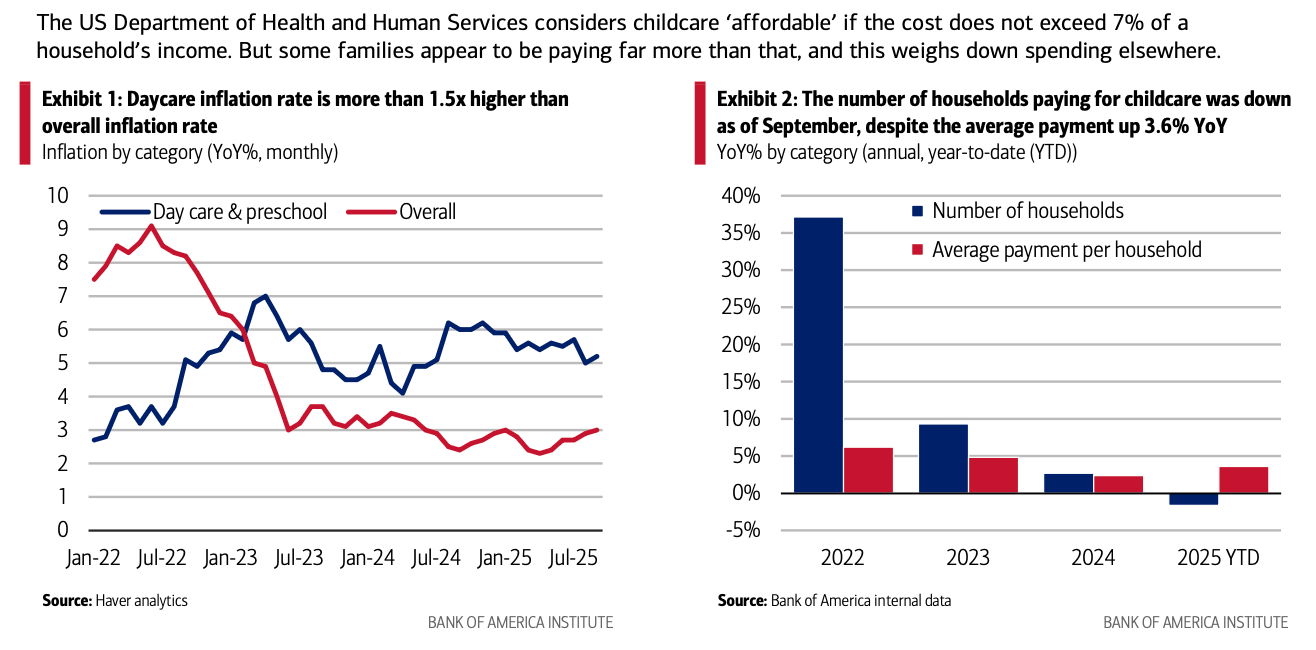
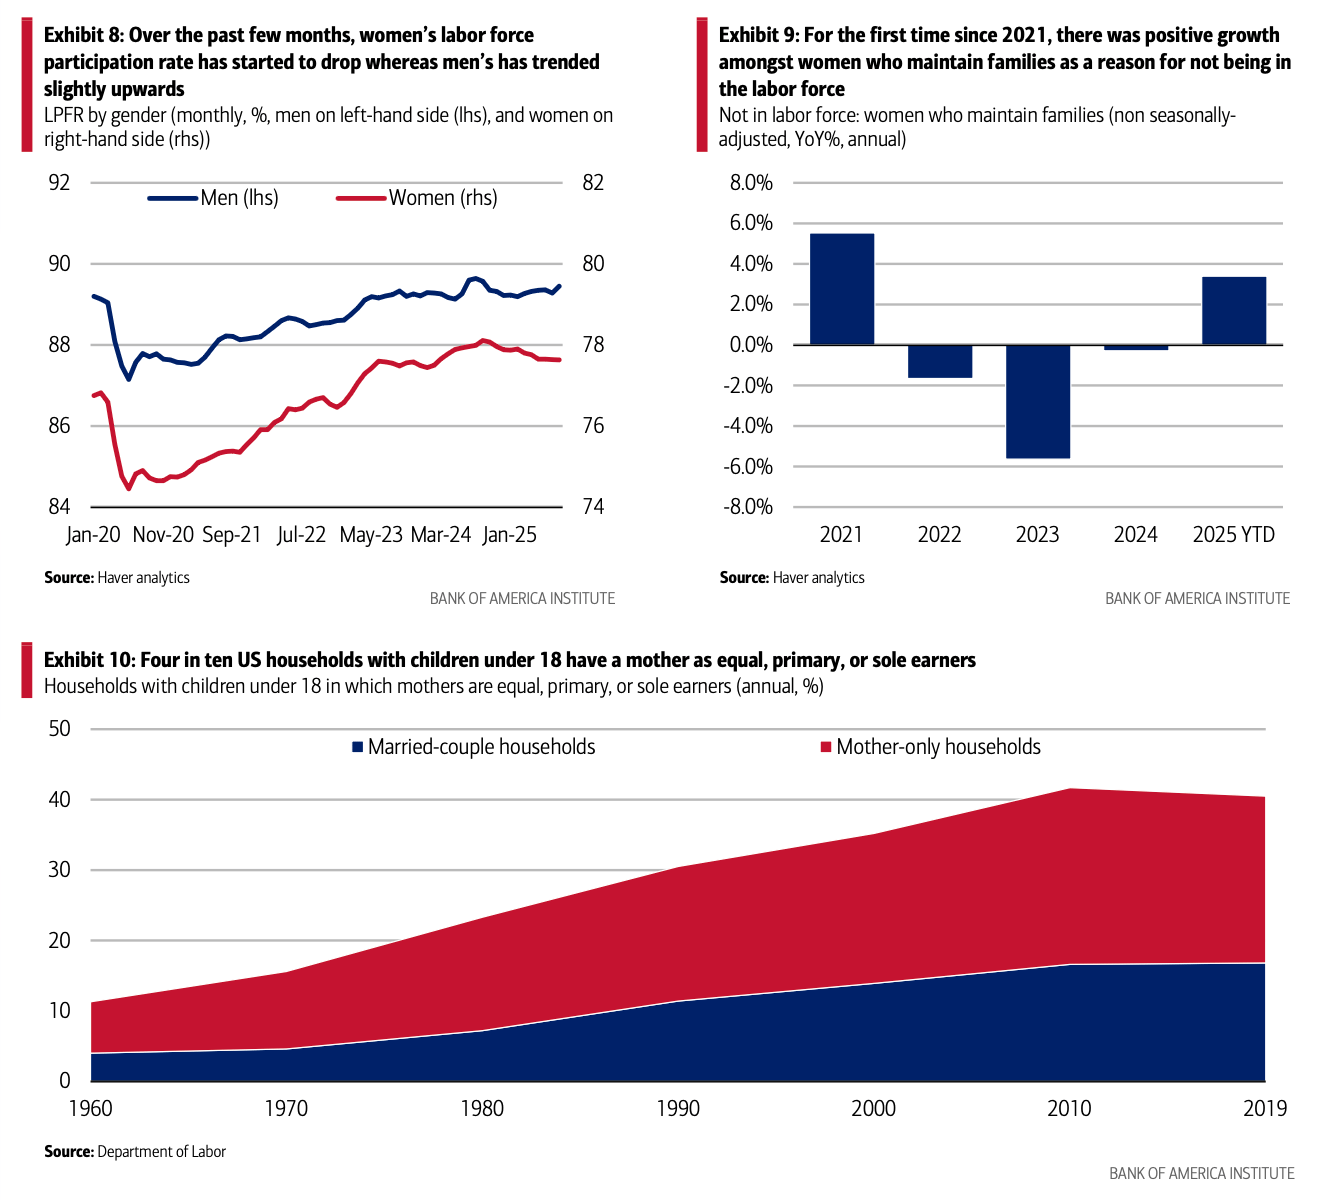
US childcare costs are rising 1.5 times faster than overall inflation, up 5.2% year-over-year (YoY) in September. This could be why the number of households making monthly childcare payments has declined, with the year-over-year percent increase in the number of households paying for child care down 1.6% YoY September, despite the average monthly payment up 3.6% YoY, according to Bank of America payments data.
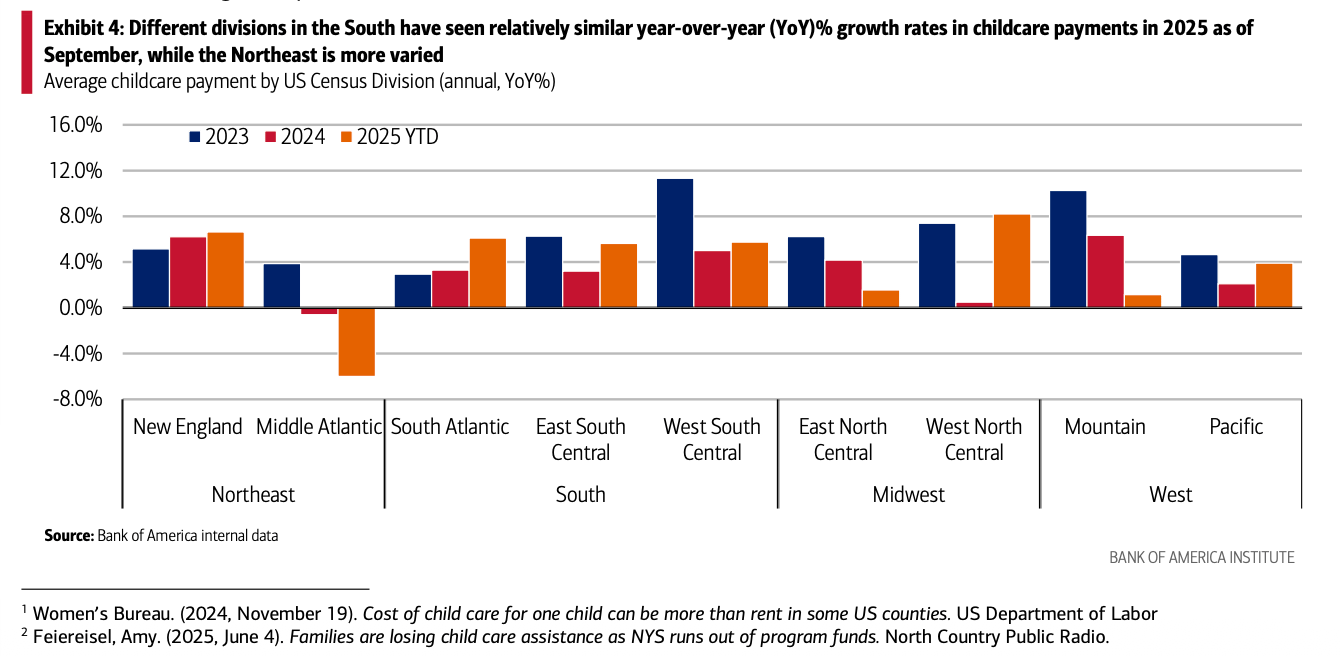
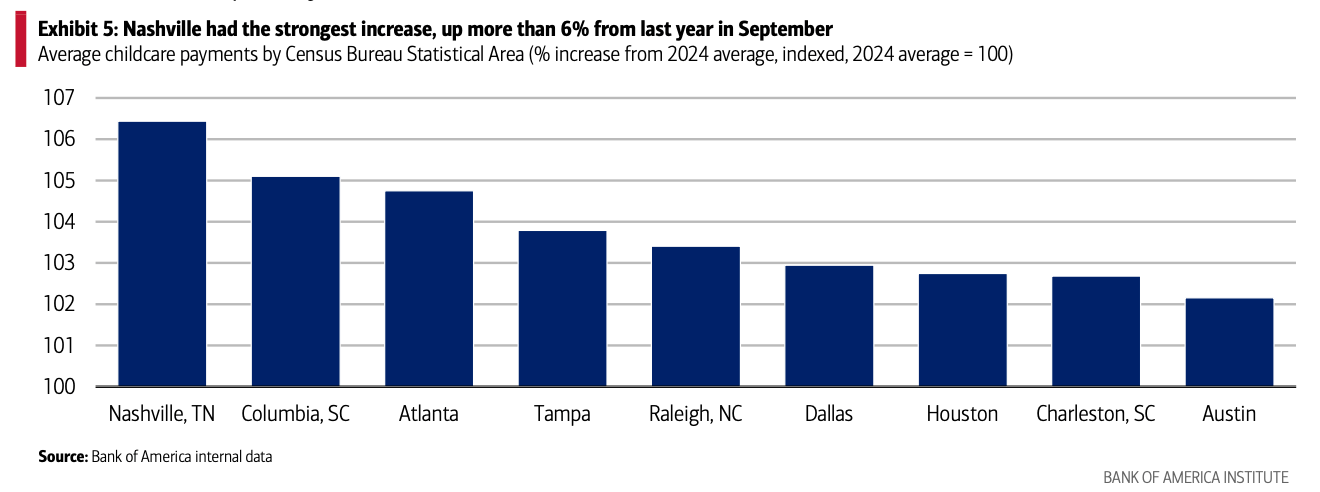
Regional disparities in childcare costs are widening. While the national average monthly childcare payment rose, some areas saw sharper increases - New England was up 6.6% and the West North Central division surged 8.2% YoY as of September. In the South, Nashville led major cities with a more than 6% increase from 2024 averages.
These spiraling costs mean some parents, especially women, are quitting work or cutting their hours to become caregivers. Bank of America data shows a drop in households receiving multiple paychecks while making childcare payments, especially among lower-income households, which suggests to us an increasing trend of some earners dropping out of the labor force to take on childcare responsibilities.
A prolonged slowdown in US housing supply has made it increasingly difficult to afford a home, according to Goldman Sachs Research. Restrictive land use regulations are the most important housing market obstacle, and addressing these constraints could significantly close the gap in supply.
The muted housing growth since the Global Financial Crisis in 2007-09 can be seen in the sharp decline in the share of homes available for sale or rent, Goldman Sachs Research economists Elsie Peng and Pierfrancesco Mei write in a report. Today, both rental and homeowner vacancy rates—the share of total housing stock available for rent and sale respectively—are below those seen in the two decades preceding the crisis and the housing market collapse that triggered it.
At least 3-4 million additional homes beyond normal construction need to be built to address the shortage in US housing supply and boost affordability, according to Goldman Sachs Research.
Land use restrictions are the biggest constraint on the growth of housing supply, and tackling that issue could help to significantly move the market back into balance.

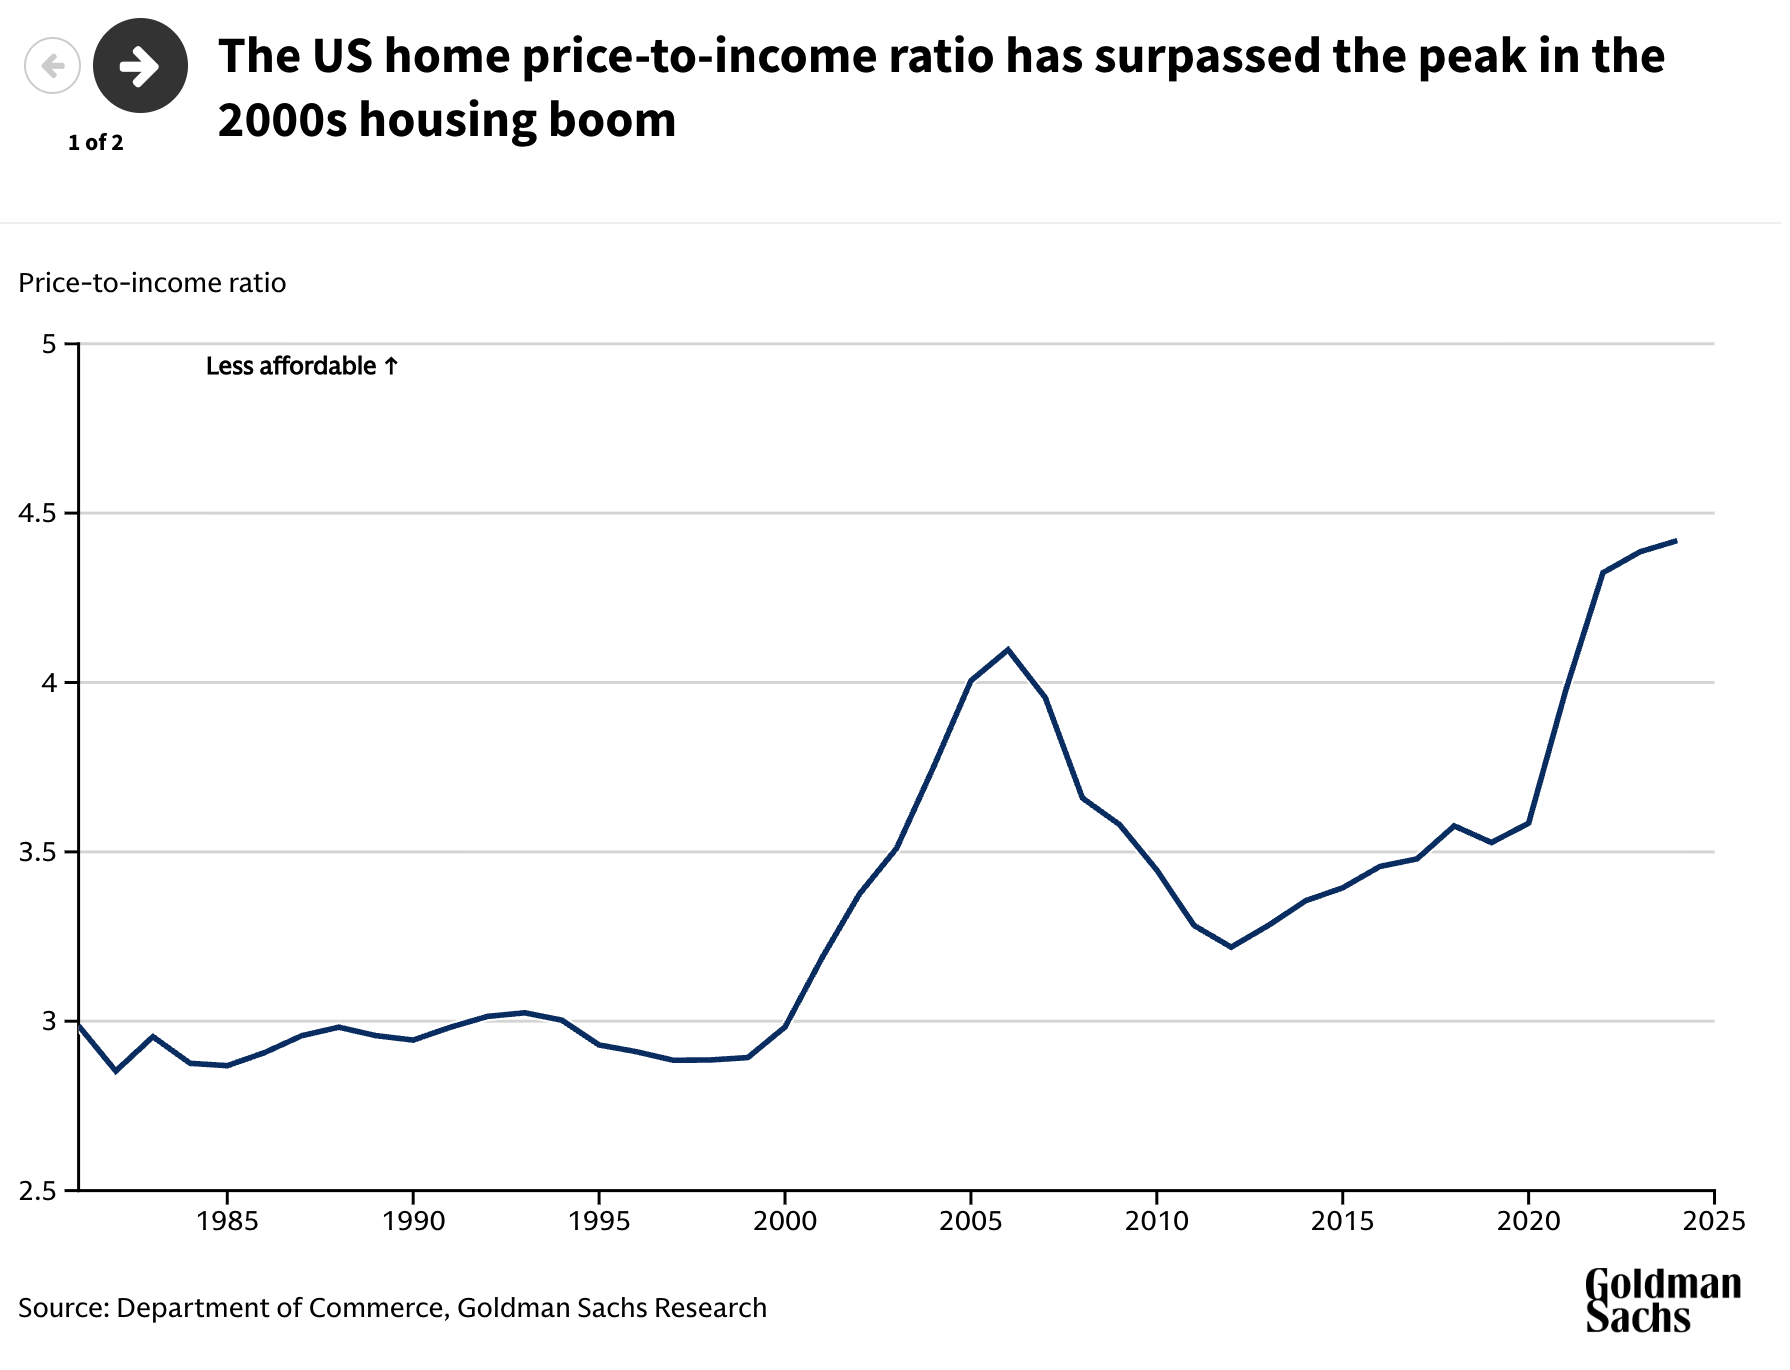
Rents and mortgage payments are taking a bigger chunk of income, according to multiple measures, and the trend accelerated post-pandemic.
The home price-to-income ratio, for example, has surpassed the peak it reached in the 2000s housing boom, according to Goldman Sachs Research. Mortgage rates surged to a 20-year high in 2022 and have stayed elevated since. The average monthly mortgage payment as a share of potential home buyers’ income has risen from below 20% prior to the pandemic to a historically high ratio of over 30% since 2022. Affordability is less of a problem in the rental market, but still, the rent-to-income ratio of today is at its highest level since 1980, Peng and Mei note.
Our economists looked at what it would take to restore price-to-income and rent-to-income ratios back to levels seen in the 1990s. They also assessed what would be needed to get vacancy rates back to where they were in that period.
Their analysis suggests that fixing the shortage and restoring affordability will require the addition of around 3-4 million housing units. That’s equal to about 2% to 2.6% of the current housing stock. Researchers elsewhere have estimated that the US housing shortfall is between 1.5 million and 5.5 million units, or as much as 3.7% of today’s supply of homes.
Height restrictions hold construction to a maximum of about two or three stories on around 60% of residential land in the 240 largest US metropolitan areas. That’s similar to the height of a single-family home. Buildings are allowed to rise to five stories or more on just 7% of all residential land. There are also regulations affecting minimum lot size and open space, and rules about the maximum number of households allowed in a building.
“The fragmentation of US land use policies has made large-scale reforms particularly challenging to implement,” Peng and Mei write.
The economists simulated how housing production might respond if regulations in major metropolitan areas were reduced to match the rules that prevail in the 25% of cities with the least stringent land use restrictions. The analysis shows that around 2.5 million more housing units would be added in the next decade under this scenario. This would eliminate about two-thirds of the estimated housing shortage, the researchers find.
There are other constraints beyond zoning and land use rules. There has been a steady decline in land available for housing near city centers. The share of land that is both vacant and available for development has decreased from more than 70% at the start of the 1960s to about 40% today.
Another drag on housing supply is declining productivity and a shortage of skilled labor in construction. Productivity in the housing industry has been trending lower for decades. While this is partly explained by costs related to land-use rules and land availability, it’s also likely driven by slower technology investment in construction and increased barriers for new homebuilders to enter the market, Peng and Mei write.
As a result, it takes longer than ever to complete housing construction. Average completion times have recently touched all-time highs for both single family homes and multifamily projects.

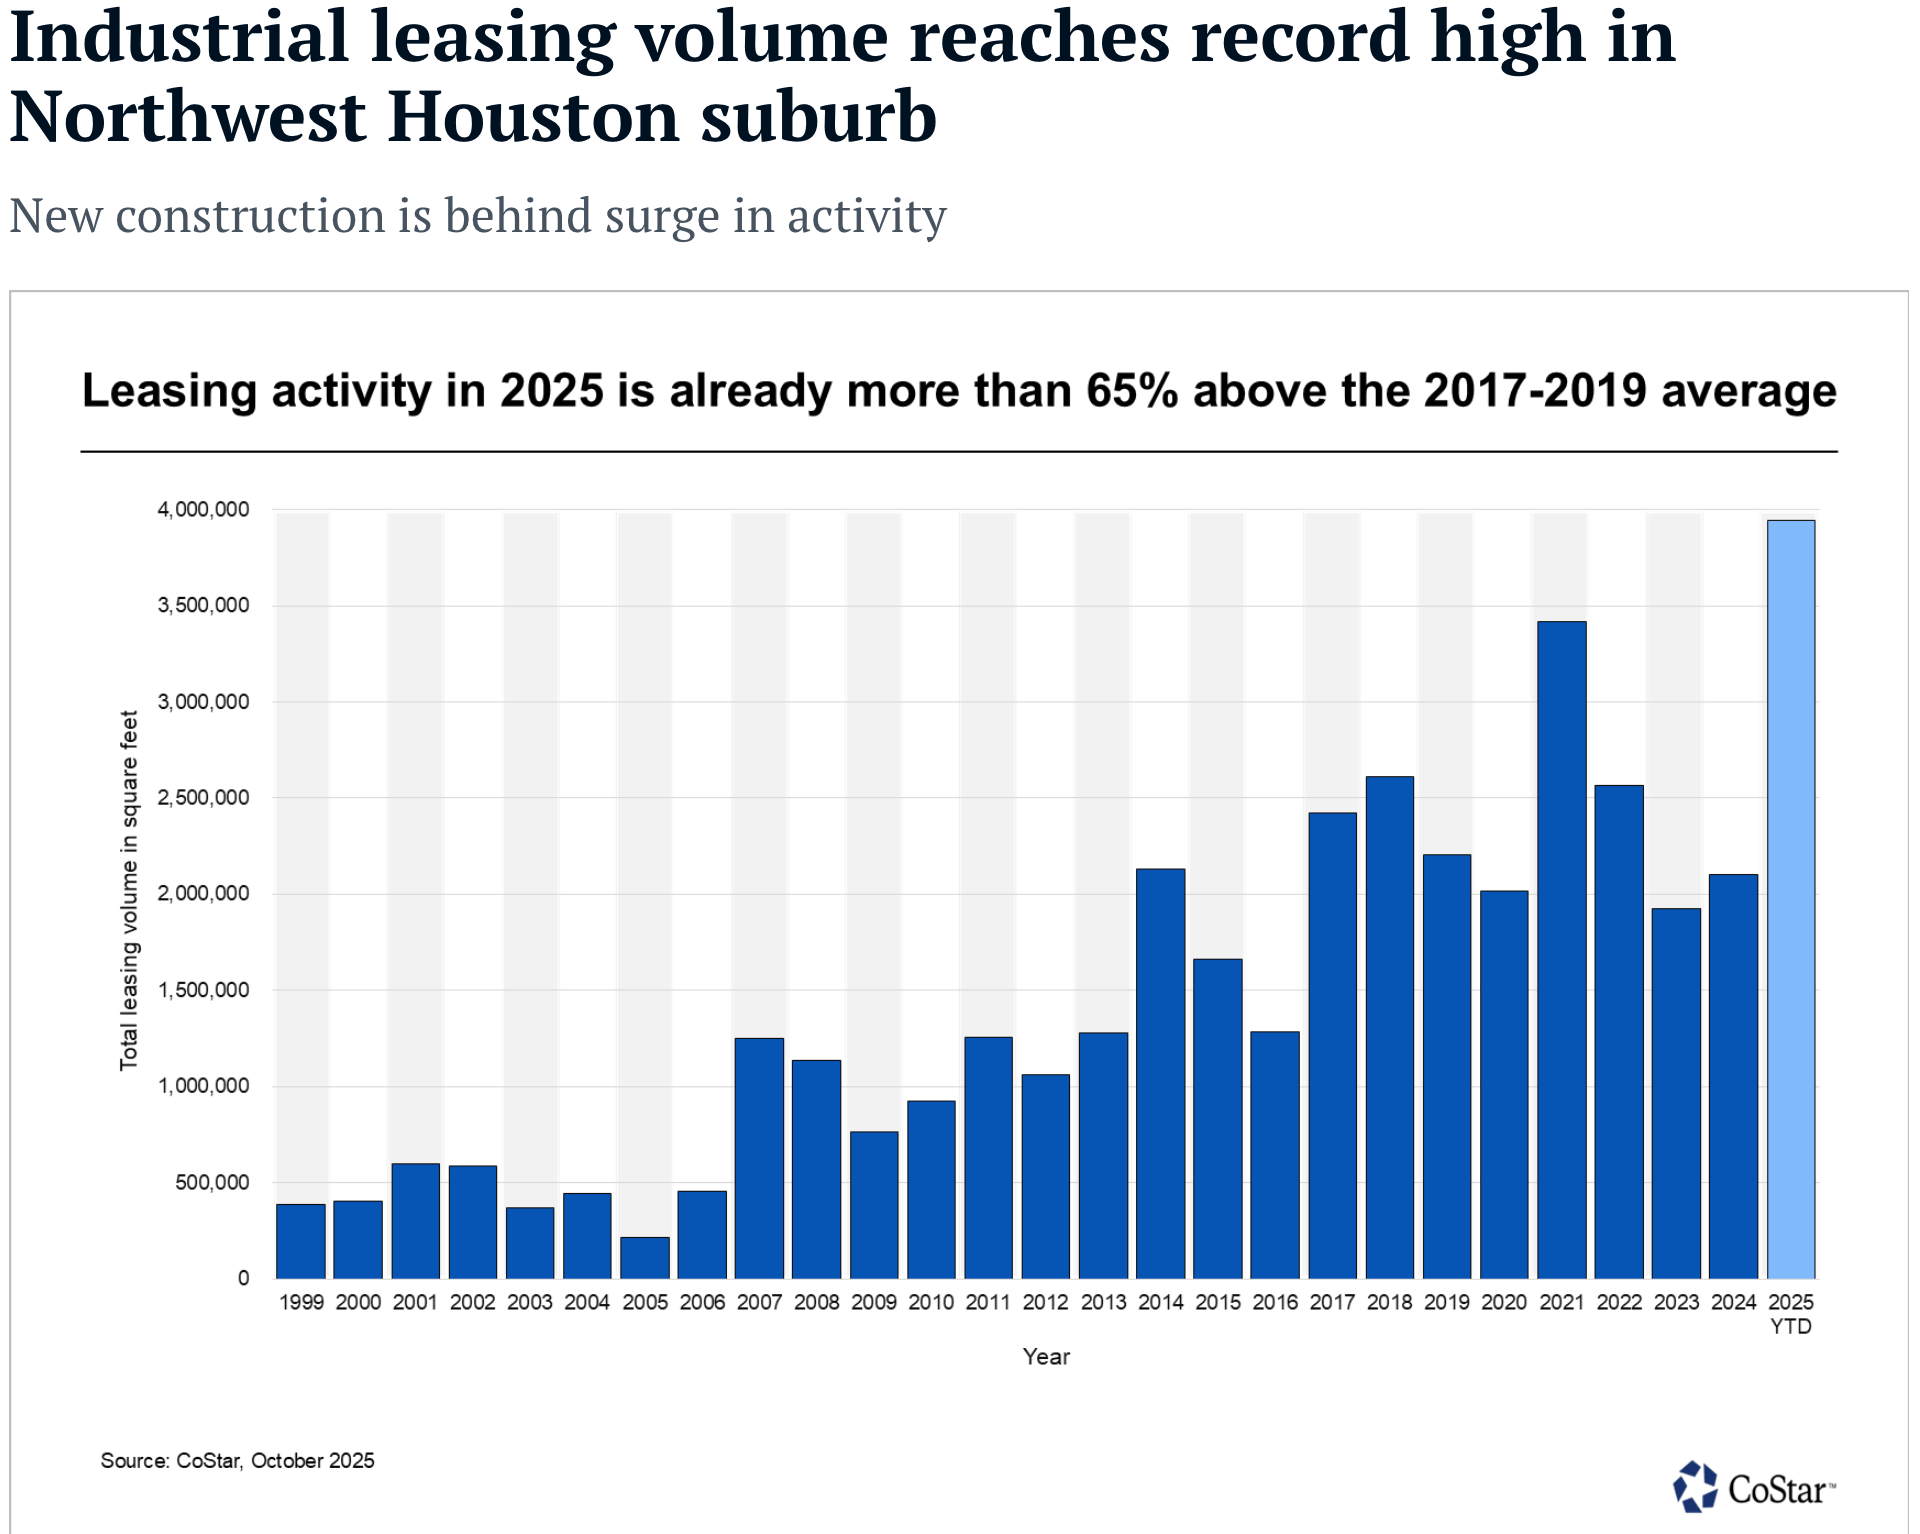
While both nationally and in Houston leasing volume has slowed from the post-pandemic highs, in Houston's North Freeway-Tomball Parkway area, leasing volume has already reached nearly 4 million square feet this year, marking the strongest annual performance on record and over 65% above the 2017–2019 average.
Tenants tied to logistics and tenants remain active, often targeting brand-new properties. In one of the largest leases this year, Panelmatic signed for an entire 730,000-square-foot warehouse in WestPoint 45. The property was built earlier this year.
While the broader Houston metro has seen a slowdown in new construction — driven by high borrowing and building costs — select segments like WestPoint 45, Southwest Far and South Highway 35 have defied the trend, launching large speculative projects in recent quarters. A common thread among these areas is their proximity to Beltway 8, Houston's 88-mile loop.
The North Freeway-Tomball Parkway area is strategically located near some of Houston's fastest-growing residential areas and is intersected by key transportation corridors. At its core is the 970-acre Pinto Business Park, situated at Beltway 8 and I-45 — the largest fully entitled, contiguous tract of land within Beltway 8. Major multinational companies anchor the park, reinforcing its role as a premier industrial hub. Notable tenants include Coca-Cola, which occupies a 1 million-square-foot build-to-suit facility, and Amazon, with over 850,000 square feet.
One standout project is Vivagi's 730,000-square-foot WestPoint 45 distribution center, completed in March. Built on spec, the property was fully leased within four months to an undisclosed tenant. With 40-foot clear heights, it ranks among the tallest in the area.
This part of Houston has benefited significantly from Houston's outward population expansion. Developers across building classes have followed suit, drawn by the area's connectivity via I-45, Grand Parkway and Beltway 8 to the northern and western suburbs — where much of the growth is concentrated. Over the past 10 years, the segment's industrial inventory has nearly doubled. The average building age is around 20 years, notably younger than the urban core, where buildings in the downtown-NW Inner Loop average over 50 years old.
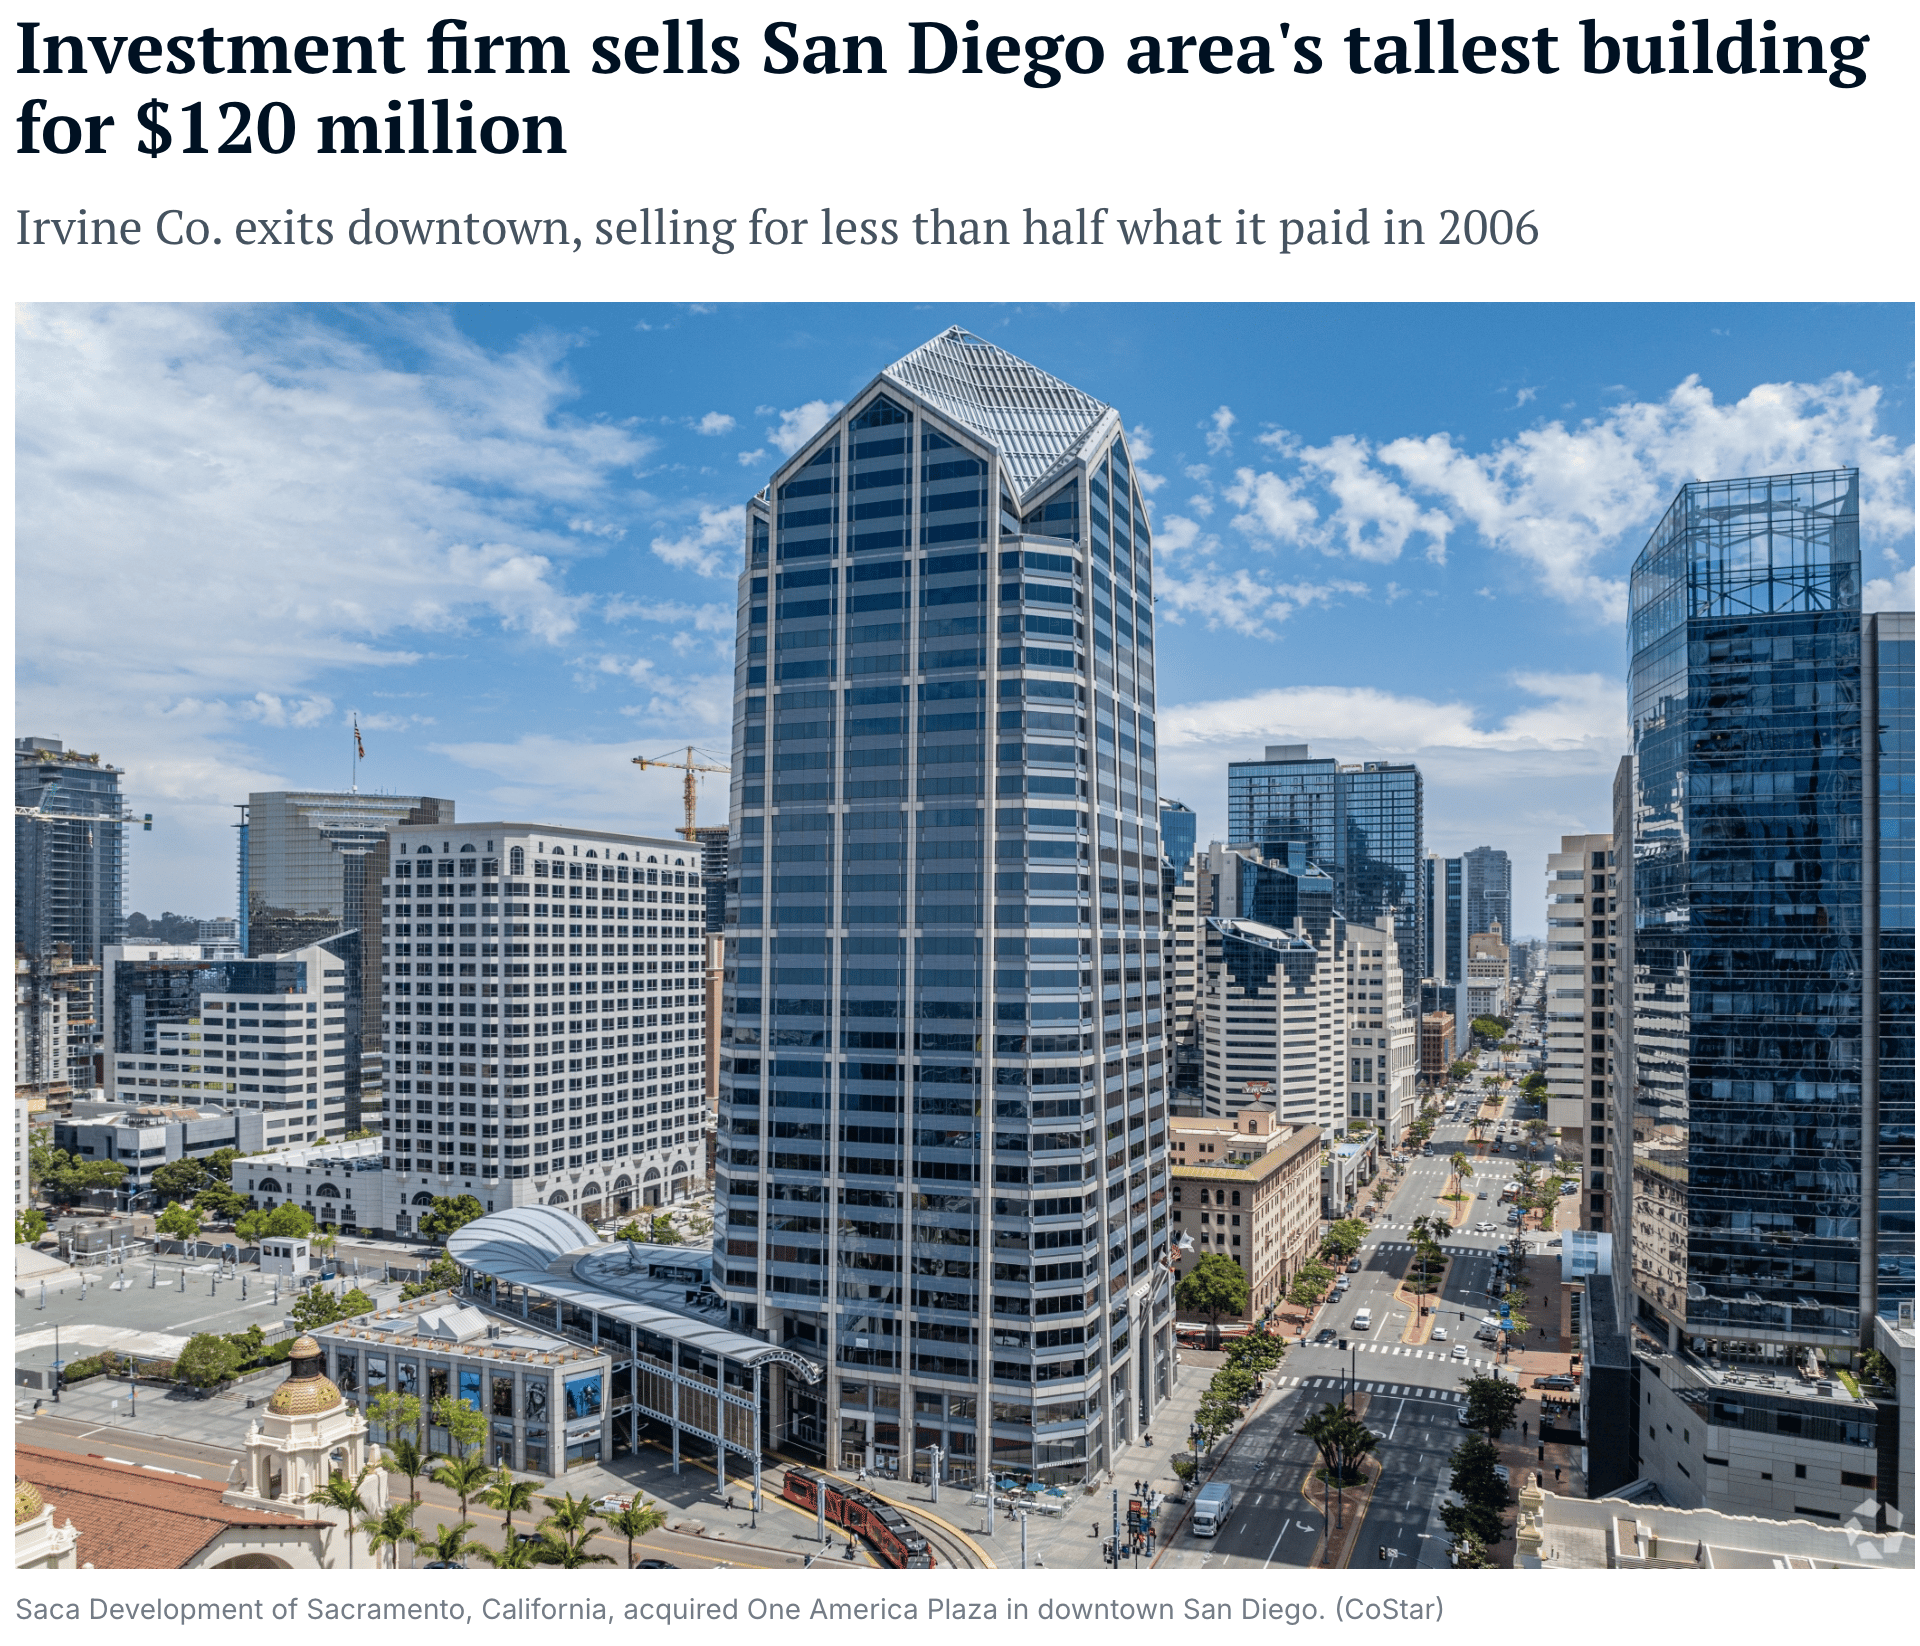
Irvine Co. sold One America Plaza, San Diego’s tallest skyscraper, in a $120 million deal marking its sixth office tower sale of the past year and its exit from the struggling downtown market at a 60% discount to what they paid for it in 2006- ~300M
Newport Beach, California-based Irvine Co., among the state’s largest owners of commercial real estate, sold the 34-story tower built in 1992 at 600 W. Broadway, according to public filings. The buyer was Saca Development of Sacramento, which last year bought another nearby downtown tower from Irvine Co. for $44 million.
It has also acquired and developed properties in recent years in markets like Chicago and New York. At UTC, about 10 miles north of downtown San Diego, Irvine Co. owns nearly half of the existing office inventory and recently announced plans to redevelop some of its older buildings in that enclave to include apartments and other non-office elements.
Like many U.S. urban hubs with older office buildings, downtown San Diego has been struggling with rising vacancies -downtown San Diego office vacancy at 34.5%.